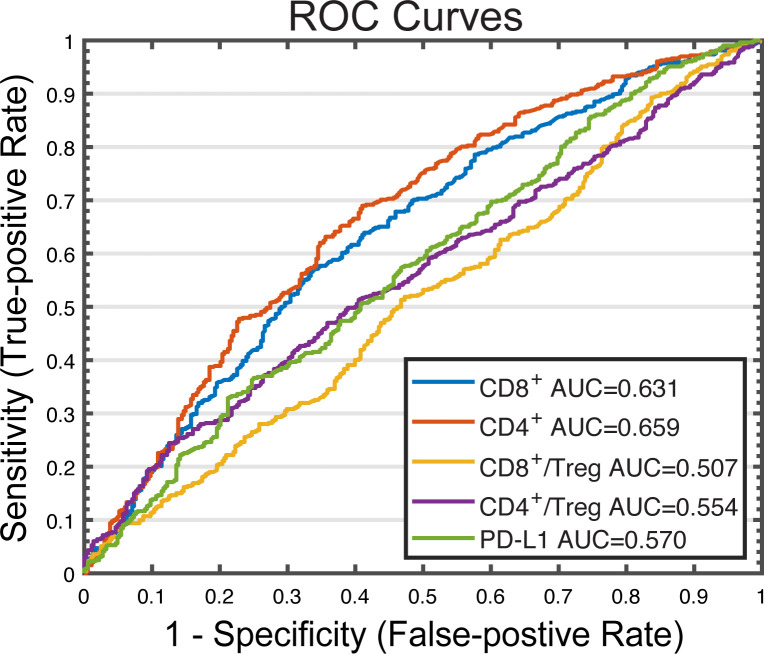
Figure 5.
ROC analysis of potential predictive biomarkers in combination therapy. Cut-off values are selected based on the range of PD-L1 molecules on APCS, pretreatment effector T cell density, tumor mutational burden, and Teff to regulatory T cell ratio. For each cut-off value, response status (R vs NR) is predicted for each virtual patient by comparing the pretreatment amount of the potential predictive biomarker to the cut-off value. Sensitivity (true positive rate) is plotted against 1 − specificity (true negative rate) for each biomarker. APCs, antigen-presenting cells; AUC, areas under curve; NR, non-responders; R, responders; ROC, receiver operating characteristic.

