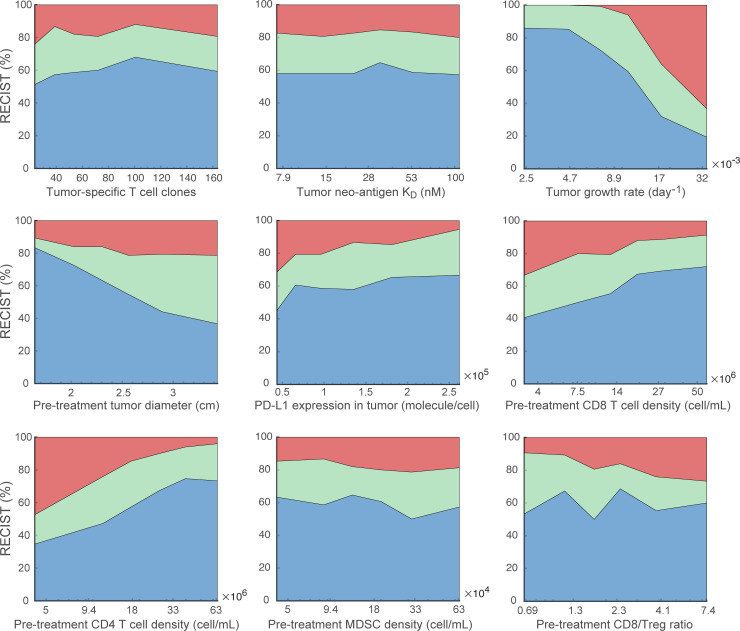
Figure 6.
Effects of parameters on objective response. For each parameter of interest, 900 virtual patients are sorted by the parameter values in ascending order and evenly divided into nine subgroups. The response status of each subgroup in the combination therapy is plotted against the corresponding median parameter values. MDSC, myeloid-derived suppressor cells.

