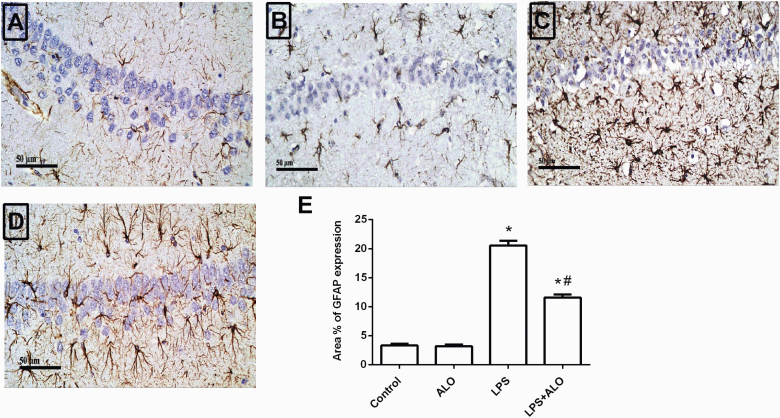
Figure 6.
Effects of lipopolysaccharide (LPS) and alogliptin on glial fibrillary acidic protein (GFAP) immunohistochemical analysis in the hippocampus. Representative photomicrographs (scale bars = 50 μm) for the control (A), alogliptin (ALO) (B), LPS (C) and LPS+ALO groups (D). The quantitative analysis of the mean area percentage of GFAP expression (E). Data are expressed as mean ± SEM (n = 4). Statistical analysis was done using 1-way ANOVA followed by Tukey’s post-hoc test. *P < .05 vs control, #P < .05 vs LPS group.

