Figure 1.
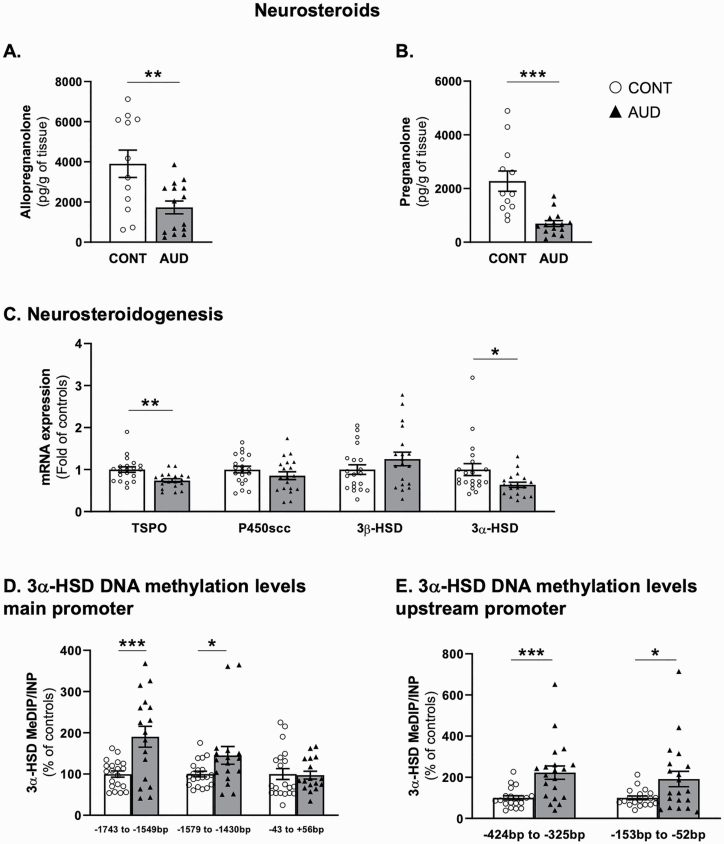
Cerebellar neurosteroidogenesis in individuals with alcohol use disorder (AUD). (A) Allopregnanolone (t1,25 = 3.1, P = .005) and (B) pregnanolone (t1,25 = 4.4, P = .0002) cerebellar levels (pg/g of tissue). mRNA expression of (C) 18 kDa translocator protein (TSPO, t1,37 = 3.3, P = .002), Mitochondrial Cholesterol Side-Chain Cleavage Enzyme (p450scc, t1,37 = 1.2, P = .2), 3β-hydroxysteroid dehydrogenase (3β-HSD, t1,37 = 1.3, P = .2), and 3α-HSD (t1,37 = 2.3, P = .03). Methylation levels measured by methylated DNA immunoprecipitation (MeDIP) of 3α-hydroxysteroid dehydrogenase (3α-HSD) (D) main promoter (from −1743 to −1594 bp: t1,35 = 3.6, P = .0008; −1579 to −1430 bp: t1,35 = 2.1, P = .04; −43 to +56 bp: t1,35 = 0.15, P = .88), (E) upstream promoter (from −424 to −325 bp: t1,38 = 3.6, P = .0009; from −153 to −52 bp: t1,38 = 2.4, P = .02). Methylation levels of 3α-HSD upstream promoter (−153 to −52 bp) negatively correlated with ethanol daily consumption (r = 0.31, P = .049); no significant correlation was observed with the number of standard drinks per week or the drinking years. These correlations were not significant when only considering the AUD group. Values are mean ± SEM of 12 control and 16 AUD samples for neurosteroid measurement, 18–20 samples per group for mRNA expression and 17–20 samples per group for DNA methylation levels determination depending on samples availability. *P < .05, **P < .01, ***P < .001, Student’s t test vs controls.

