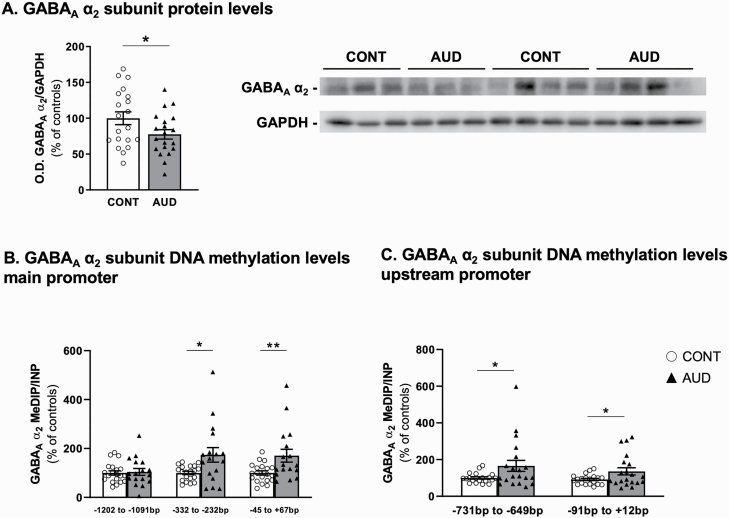
Figure 2.
GABAA receptor α 2 subunit protein levels and promoter methylation in cerebellum of individuals with alcohol use disorder (AUD). Protein levels of GABAA receptor subunit α 2 measured as ratio of α 2 /GAPDH optical density (O.D.) expressed as percent of controls (t1,38 = 2.03, P = .049). Representative western blots are shown on the right side. Methylation levels measured by methylated DNA immunoprecipitation (MeDIP) of GABAA receptor subunit α 2 (GABRA2) (B) main promoter region (from −1202 to −1091 bp: t1,35 = 0.27, P = .79; −332 to −232 bp: t1,35 = 2.61, P = .01 −45 bp to +67 bp: t1,35 = 2.73, P = .0098), (C) upstream promoter (from −731 to −649 bp: t1,38 = 2.15, P = .04; from −91 to +12 bp: t1,38 = 2.15, P = .04). GABAAR α 2 upstream promoter methylation levels at both measured locations inversely correlated with protein expression (−731 to −649 bp, r = −0.4, P = .01; −91 to +12 bp, r = −0.39, P = .01). No significant correlation was observed with α 2 mRNA expression (r = −0.08, P = .59; r = −0.08, P = .61, respectively). Values are mean ± SEM of 19–20 samples per group for protein levels. A total 17–20 samples per group were used for DNA methylation levels determination depending on samples availability. *P < .05, **P < .01, Student’s t test vs controls.

