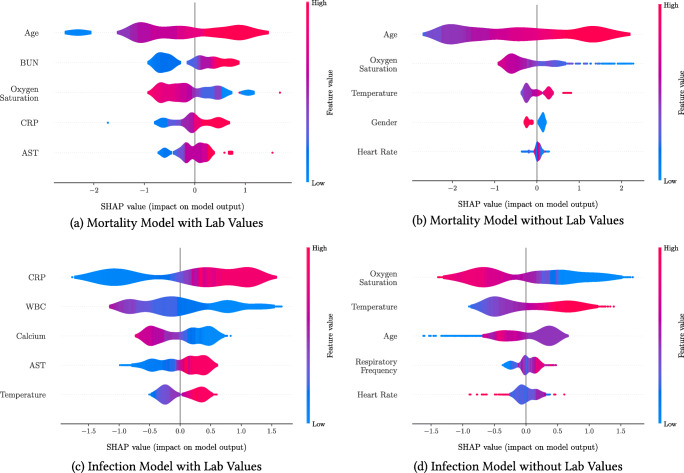
Fig. 3.
SHapley Additive exPlanations (SHAP) importance plots for the mortality and infection risk calculators. The five most important features are shown for each model. Gender is a binary feature (female is equal to 1, shown in red; male is equal to 0, shown in blue). Each row represents the impact of a feature on the outcome, with higher SHAP values indicating higher likelihood of a positive outcome

