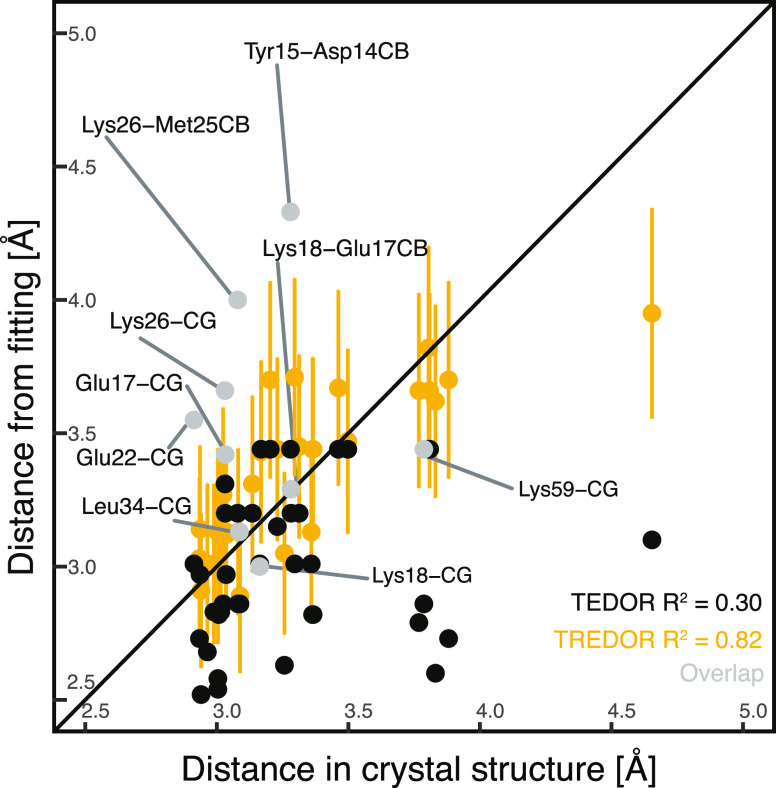
Figure 7.
Comparison of NMR-derived distances that define χ1 and ψ torsion angles for residues with a single conformer in the crystal structure. Distances are compared with those of the crystal structure 2NUZ either fitting with pseudo-4D TREDOR data (yellow and gray) or only the N–C TEDOR component (black). Long-range contacts or ambiguous torsion angle restraints are not included in the analysis to exclude potential assignment errors. Contacts with overlapped nitrogen signals are shown in gray and were not included in the determination of R2. Pseudo-4D TREDOR predicts distances (R2 0.82) more accurately than TEDOR (R2 0.30) with data from 3 mixing times. Yellow error bars are indicated at ±10% to indicate the expected error from ignoring relative orientations.35

