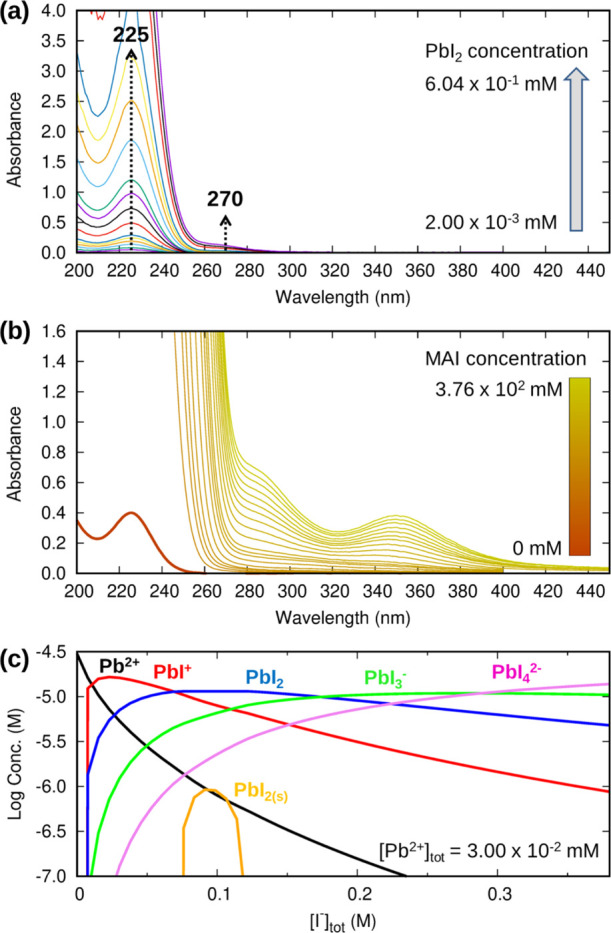
Figure 3.

(a) Experimental UV–vis spectra of PbI2 at different concentrations. (b) Experimental UV–vis spectra of PbI2 3.00 × 10⁻² mM + MAI (from 2.00 to 3.76 × 10² mM). (c) Estimated concentration diagram of aqueous iodoplumbates for a 3.00 × 10⁻² mM PbI2 solution upon addition of MAI with a maximum concentration of 3.76 × 10² mM. The concentration of I– is out of range.
