
FIGURE 11.
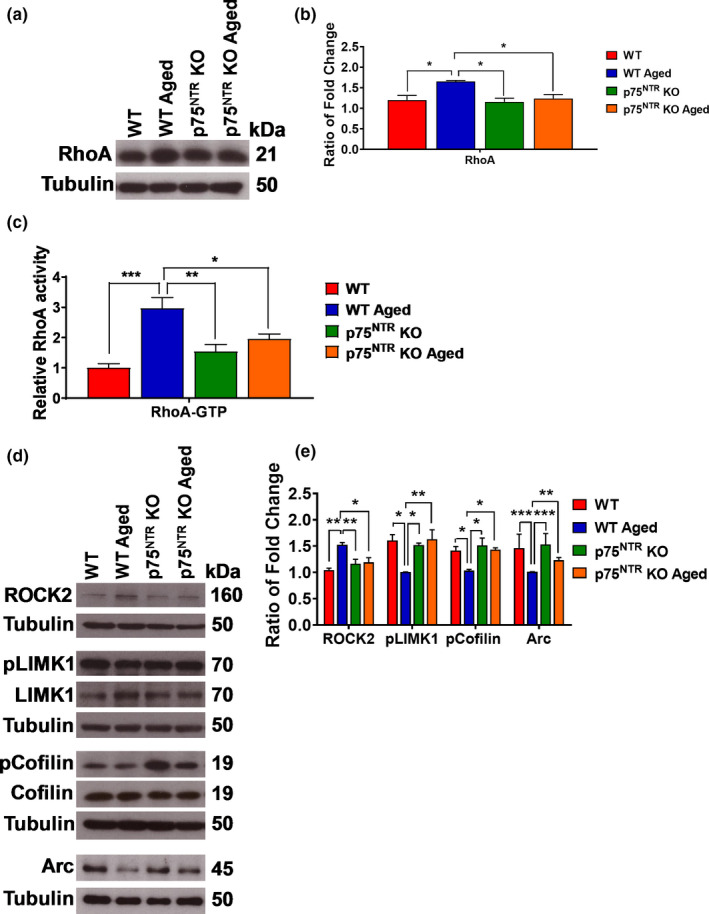
Effects of age on RhoA, ROCK2, LIMK1, cofilin, and Arc levels in the hippocampus. (a) Western blot analysis of hippocampal RhoA level between young adult and aged from both WT and p75NTR KO mice. (b) Ratio of fold change from Western blot. The RhoA level was significantly increased in aged WT mice compared to young adult WT (p = 0.0338), young adult p75NTR KO (p = 0.0206), and aged p75NTR KO (p = 0.0488) mice, N = 4 for each group. (c) ELISA analysis of hippocampal RhoA‐GTP activity between young adult and aged from both WT and p75NTR KO mice. The RhoA‐GTP activity was significantly increased in aged WT mice compared to young adult WT (p = 0.0002), young adult p75NTR KO (p = 0.0021), and aged p75NTR KO (p = 0.0192) mice, N = 5 for each group. (d) Western blot analysis of hippocampal ROCK2, LIMK1, cofilin, and Arc levels between young adult and aged from both WT and p75NTR KO mice. (e) Ratio of fold change from Western blot. The ROCK2 level was significantly increased in aged WT mice compared to young adult WT (p = 0.0012), young adult p75NTR KO (p = 0.0085), and aged p75NTR KO (p = 0.0135) mice, N = 4 for each group. The phosphorylated LIMK1 protein level was significantly decreased in aged WT mice compared to young adult WT (p = 0.0111), young adult p75NTR KO (p = 0.0223), and aged p75NTR KO (p = 0.0091) mice, N = 3 for each group. The phosphorylated cofilin level was significantly decreased in aged WT mice compared to young adult WT (p = 0.0499), young adult p75NTR KO (p = 0.0201), and aged p75NTR KO (p = 0.0427) mice, N = 3 for each group. The Arc level was significantly decreased in aged WT mice compared to young adult WT (p = 0.0008), young adult p75NTR KO (p = 0.0002), and aged p75NTR KO (p = 0.0017) mice, N = 4 for each group. The values of the individual groups were calculated in relation to the control group, while tubulin serves as a loading control. Asterisk indicates significant differences between groups (two‐way ANOVA, *p < 0.05, **p < 0.01, ***p < 0.001). Error bars indicate ± SEM