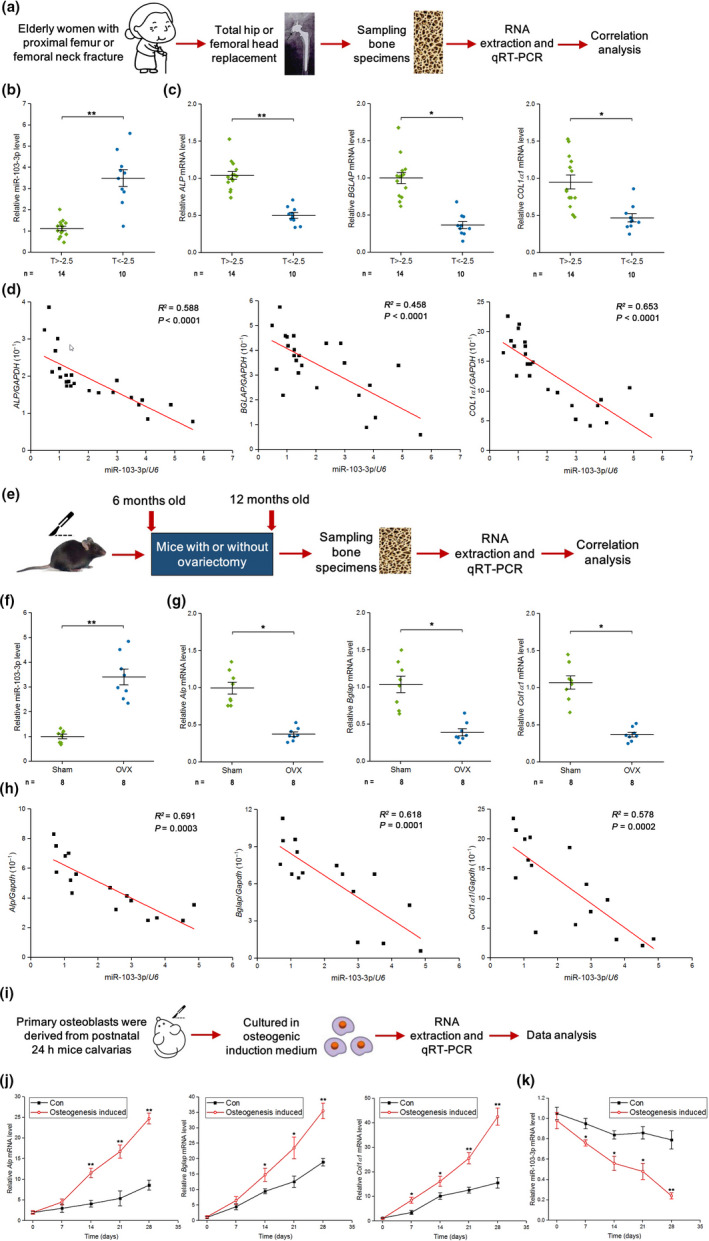
FIGURE 1.

miR‐103‐3p levels are negatively correlated with bone formation capacity in human bone specimens, mouse bone specimens, and primary mouse osteoblasts. (a) Schematic diagram illustrating the experimental design. (b) Real‐time PCR analysis of the bone mineral density‐related changes in miR‐103‐3p levels in bone specimens from patients. The relative miRNA levels were normalized to the mean value of the T > −2.5 group. U6 small nuclear RNA was used as the internal control. (c) Real‐time PCR analysis of the bone mineral density‐related changes in the mRNA levels of the bone formation marker genes ALP (left), BGLAP (middle), and COL1α1 (right) in bone specimens from patients. The relative mRNA levels were normalized to the mean value of the T > −2.5 group. Human GAPDH mRNA was used as the internal control. (d) Correlation analysis between the miR‐103‐3p level and ALP (left), BGLAP (middle), and COL1α1 (right) mRNA levels in bone specimens from patients. (e) Schematic diagram illustrating the experimental design. (f) Real‐time PCR analysis of the changes in miR‐103‐3p levels in bone specimens from Sham or OVX mice. The relative miRNA levels were normalized to the mean value of the Sham group. U6 small nuclear RNA was used as the internal control. (g) Real‐time PCR analysis of the changes in the mRNA levels of the bone formation marker genes Alp (left), Bglap (middle) and Col1α1 (right) in bone specimens from Sham or OVX mice. The relative mRNA levels were normalized to the mean value of the Sham group. Mouse Gapdh mRNA was used as the internal control. (h) Correlation analysis between the miR‐103‐3p level and Alp (left), Bglap (middle), and Col1α1 (right) mRNA levels in bone specimens from Sham or OVX mice. (i) Schematic diagram illustrating the experimental design. (j) Real‐time PCR analysis of Alp (left), Bglap (middle), and Col1α1 (right) mRNA levels in primary mouse osteoblasts during osteoblast maturation (n = 4). (k) Real‐time PCR analysis of miR‐103‐3p levels in primary mouse osteoblasts during osteoblast maturation (n = 4). The n value for each group is indicated at the bottom of each bar in the graphs. All data are the mean ± SD. *p < 0.05, **p < 0.01. One‐way analysis of variance (ANOVA) with a post hoc test was performed, and the significance of differences between two groups was determined with Student's t test. For statistical correlation, Pearson's correlation coefficient was used
