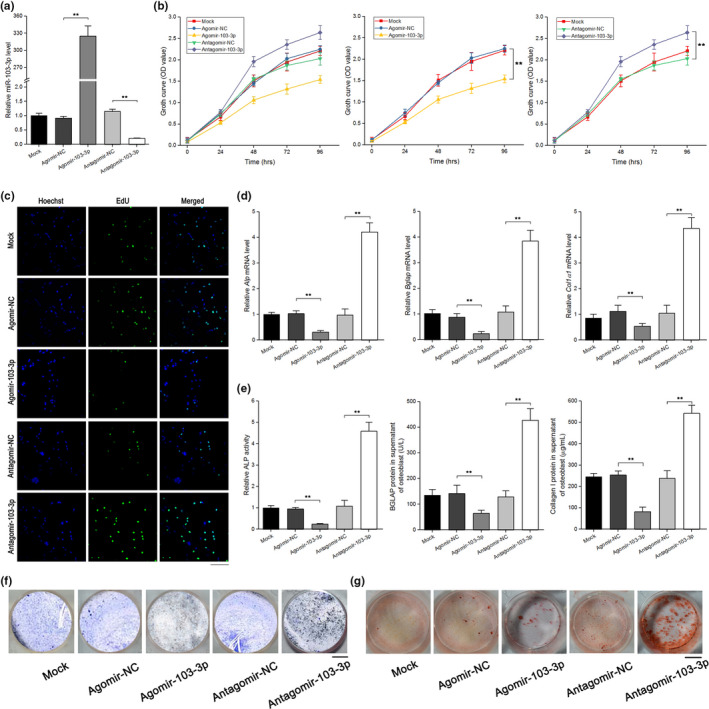
FIGURE 2.

miR‐103‐3p inhibits osteoblast activity in vitro. (a) Real‐time PCR analysis of miR‐103‐3p levels in primary mouse osteoblasts after treatment with 300 μM agomir‐103‐3p, antagomir‐103‐3p, or the corresponding negative controls for 48 h (n = 3). (b) WST‐8 assay of changes in cell growth in each group at 24–96 h after treatment with 300 μM agomir‐103‐3p, antagomir‐103‐3p or the corresponding negative controls (n = 4). (c) EdU incorporation assay of the proliferation of primary mouse osteoblasts in each group after treatment with 300 μM agomir‐103‐3p, antagomir‐103‐3p or the corresponding negative controls for 48 h (n = 3). Cells were staining with the nucleic acid dye Hoechst (blue) and EdU (green). Scale bar, 10 μm. (d) Real‐time PCR analysis of the changes in the mRNA levels of the osteoblast differentiation marker genes Alp (left), Bglap (middle), and Col1α1 (right) in primary mouse osteoblasts after treatment with 300 μM agomir‐103‐3p, antagomir‐103‐3p, or the corresponding negative controls for 48 h (n = 4). (e) ALP activity (left) and the amount of BGLAP protein (middle) and collagen I (right) in the supernatant of primary mouse osteoblasts after treatment with 300 μM agomir‐103‐3p, antagomir‐103‐3p, or the corresponding negative controls for 48 h (n = 4). (f) Representative images of ALP staining of primary mouse osteoblasts after treatment with 300 μM agomir‐103‐3p, antagomir‐103‐3p, or the corresponding negative controls for 48 h (n = 3). Scale bar, 10 mm. (g) Alizarin red staining of calcium deposition in primary mouse osteoblasts after treatment with 300 μM agomir‐103‐3p, antagomir‐103‐3p, or the corresponding negative controls in osteogenic medium for 21 days. Scale bar, 10 mm. All data are presented as the mean ± SD. **p < 0.01. One‐way ANOVA with a post hoc test was performed, and the significance of differences between two groups was determined with Student's t test
