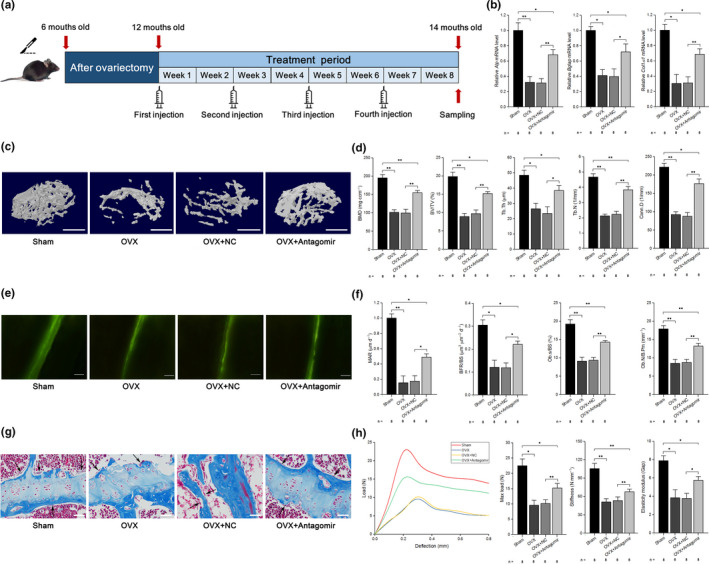
FIGURE 6.

Therapeutic inhibition of miR‐103‐3p counteracts the decrease in bone formation in mice with OVX‐induced osteoporosis. (a) Schematic diagram illustrating the experimental design. (b) Real‐time PCR analysis of Alp (left), Bglap (middle), and Col1α1 (right) mRNA levels in bone specimens from mice after treatment with antagomir‐103‐3p or its negative control. (c) Representative images showing three‐dimensional trabecular architecture determined by microCT reconstruction in the distal femurs. Scale bars, 1 mm. (d) MicroCT measurement for BMD, BV/TV, Tb.Th, Tb.N, and Conn.D in the distal femurs of mice after treatment with antagomiR‐103‐3p or its negative control. (e) Representative images of new bone formation assessed by double calcein labeling. Scale bars, 10 μm. (f) Double calcein labeling analysis of dynamic bone histomorphometric parameters (MAR, BFR/BS, Ob.s/BS, and Ob.N/B.Pm) in the distal femurs of mice after treatment with antagomiR‐103‐3p or its negative control. (g) Masson's trichrome staining analysis of osteoid formation in the distal femurs of mice after treatment with antagomiR‐103‐3p or its negative control (n = 8). Scale bars, 10 μm. Arrows indicate osteoids. (h) Three‐point bending test analysis of mouse femur biomechanical properties after treatment with antagomiR‐103‐3p or its negative control. The n value for each group is indicated at the bottom of each bar in the graphs. All data are presented as the mean ± SD. *p < 0.05, **p < 0.01. One‐way ANOVA with a post hoc test was performed, and the significance of differences between two groups was determined with Student's t test
