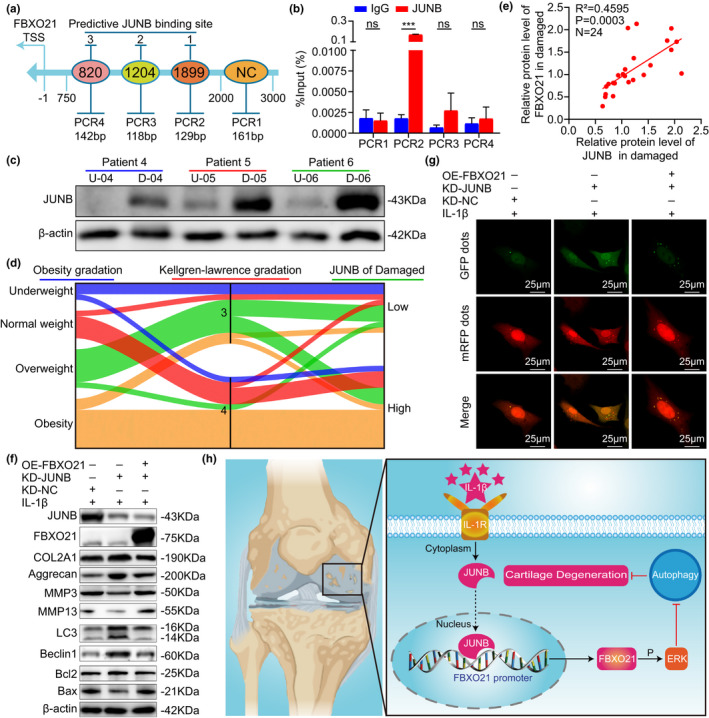
FIGURE 6.

JUNB accelerates OA‐related degeneration by promoting FBXO21 expression. (a) Schematic of the predictive binding site of JUNB at the FBXO21 promoter region 2000‐bp upstream of the transcription start site (TSS) and the TSS, which is designated as −1. 2,000–3,000 bp was used as the negative control (NC). (b) Immunoprecipitated DNA using chromatin immunoprecipitation (ChIP) assay was quantified by PCR in SW1353 cells, with normal rabbit IgG as the NC. (c) Immunoblotting results of JUNB in undamaged (U) and damaged (D) areas in the cartilage of patients with knee osteoarthritis (OA), with β‐actin as the endogenous control. U‐04: undamaged (U) area of patient‐04; D‐04: damaged (D) area of patient‐04. (d) Relationship between obesity gradation, Kellgren–Lawrence gradation and JUNB expression in the damaged area represented by a Sankey diagram. (e) Linear regression analysis of the expression of JUNB and FBXO21 in the damaged area in patients with knee OA (n = 24). (f) Immunoblotting results of JUNB, FBXO21, COL2A1, Aggrecan, MMP3, MMP13, LC3, Beclin1, Bcl2, and Bax in SW1353 cells transfected with FBXO21‐pEX3 overexpression plasmid (OE‐FBXO21) and JUNB knockdown plasmid divided into KD‐shRNA‐NC (KD‐NC) and KD‐shRNA‐JUNB (KD‐JUNB) groups, with β‐actin as the endogenous control. (g) mRFP‐GFP‐LC3 adenovirus double label in SW1353 cells after JUNB knockdown and FBXO21 overexpression. mRFP (red) indicates autolysosomes; merge (yellow) indicates autophagosomes. (h) Schematic diagram showing the proposed mechanism of accelerated cartilage degeneration by the JUNB/FBXO21/ERK axis via regulating autophagy during OA. Data are presented as the mean ± SD; ns: not significant, ***p < 0.001
