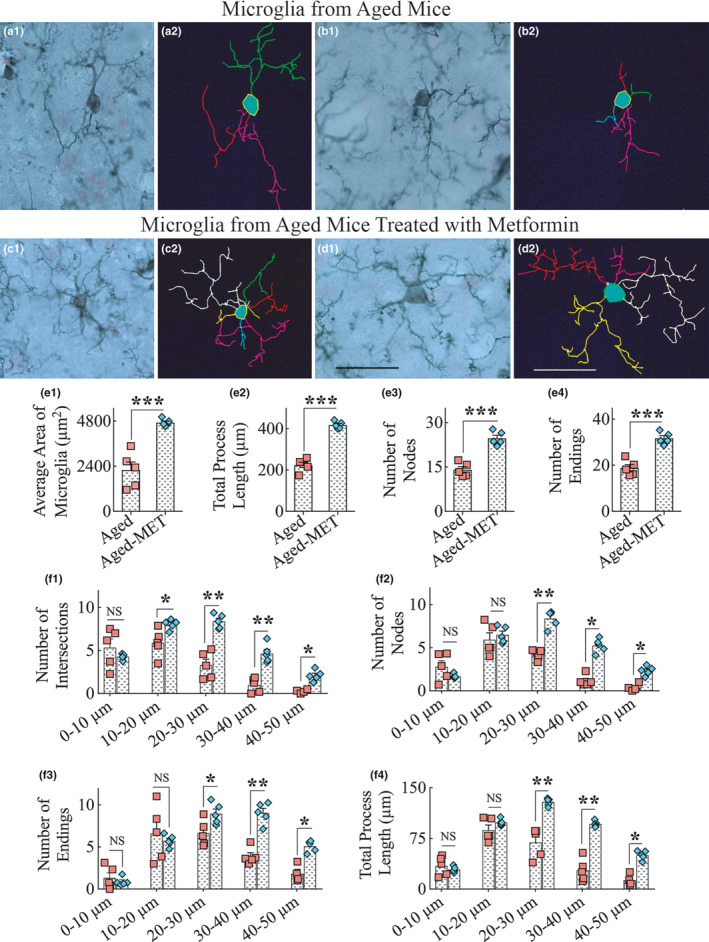
Figure 4.

Ten weeks of MET treatment to 18‐month‐old mice resulted in a greater frequency of microglia with highly ramified processes in the hippocampus. a1‐d2 show representative examples of microglial morphology traced with Neurolucida from the hippocampus of aged mice (a1–b2) and aged‐MET mice (c1–d2). Note that microglial cells from untreated aged mice display shorter processes and diminished ramification of processes (a1–b2), whereas microglia from aged‐MET mice show longer and highly ramified processes (c1–d2). The bar charts e1–e4 compare the various morphometric measures between aged mice and aged‐MET mice, which include the average area occupied by individual microglia (e1), the total process length (e2), the number of nodes (e3), and the number of process endings (e4). The bar charts f1–f4 compare the number of intersections (f1), number of nodes (f2), number of process endings (f3), and total process length (f4) between aged mice and aged‐MET group at 0–10 μm, 10–20 μm, 20–30 μm, 30–40 μm, and 40–50 μm distances from the soma. Note that a vast majority of parameters denoting the ramification of processes are enhanced in aged‐MET mice, compared to untreated aged mice. *p < 0.05; **p < 0.01; ***p < 0.001; NS, not significant. Scale bar, a1‐d2 = 25 μm
