
FIGURE 6.
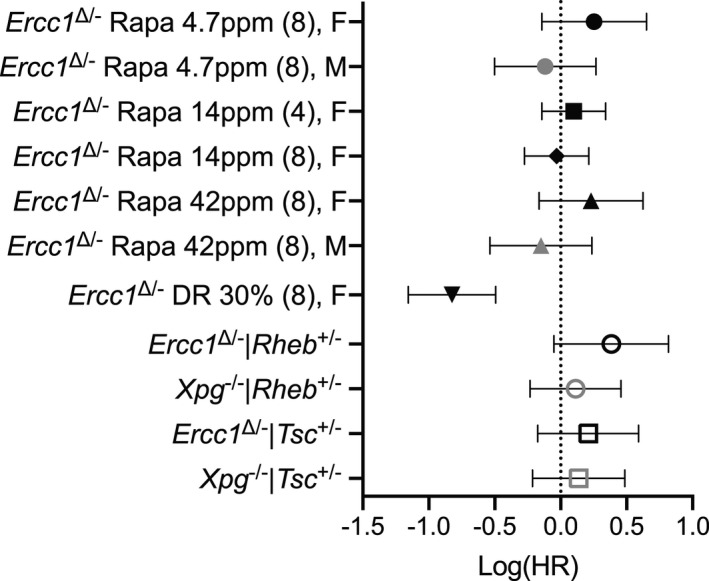
Forest plot of effect size for the logarithm of the hazard ratio (HR; with 95% confidence interval as error bars) for changes in survival of all cohorts represented in this study (data from Figures 1, 2, and 4). Rapamycin treatments per gender were compared to its own Ercc1 ∆/− control group. Dosage of rapamycin, age of initiation (between brackets), and gender F (females), M (males) are indicated. Genetic modulation of mTOR activity (by Rheb +/− and Tsc +/− mutation) was assessed mixed gender and compared to the appropriate Ercc1 ∆/− or Xpg −/− controls. Mice subjected to 30% dietary restriction (DR) were compared to the Ad libitum mock Ercc1 ∆/− control from Figure 1h. The direct comparison of DR versus rapamycin yielded a log(HR) of −0.8386 (with 95% CI of −0.5130 to −1.1641)