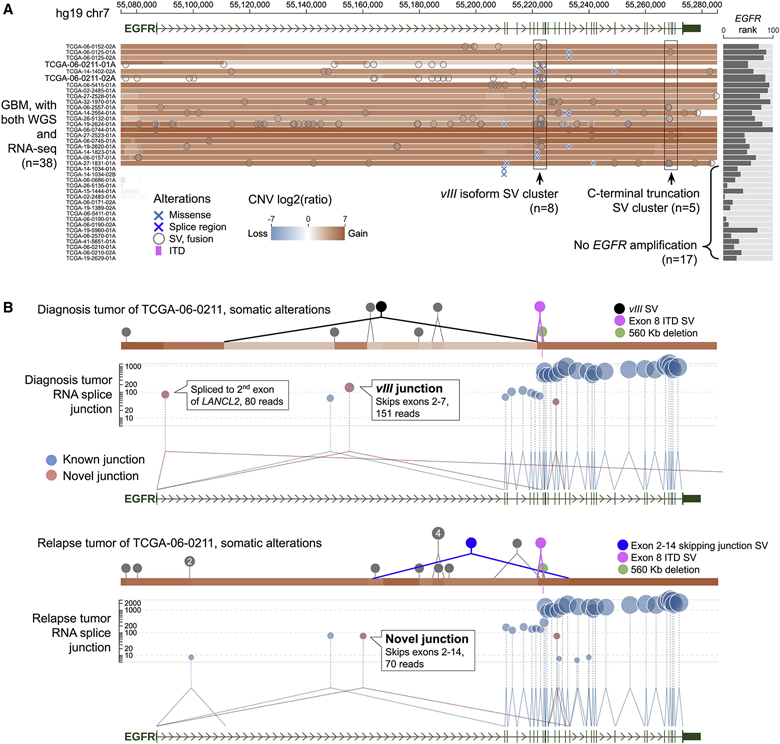
Figure 7: Visualizing intratumor heterogeneity of TCGA GBM at EGFR locus.

(A) Cohort View of somatic alterations and gene expression of 38 TCGA GBM samples with both WGS and RNA-seq data. Across the cohort, 21 tumors with amplifications at EGFR locus exhibit high EGFR expression. In each sample, structural variation breakpoints (circles) and coding mutations (X marks) are shown on top of CNV segments. Rectangular regions shown SV clusters for EGFRvIII (n=8, left) and EGFR C-terminal truncation (n=5, right).
(B) Sample View of TCGA-06-0211-01A, a diagnosis tumor (top), and its matching relapsed sample TCGA-06-0211-02A (bottom). SVs are shown as solid circles, highlighting representative SVs that are diagnosis-specific (EGFRvIII), relapse-specific (intron 1-14 deletion), or shared (exon 8 ITD and 560K deletion) by color. In RNA-seq track, novel junctions corresponding to diagnostic-specific EGFRvIII and relapse-specific exons 2-14 skipping are labeled.
See also Figures S5 and S6. Live link: https://proteinpaint.stjude.org/gp/tcga.gbm.html
