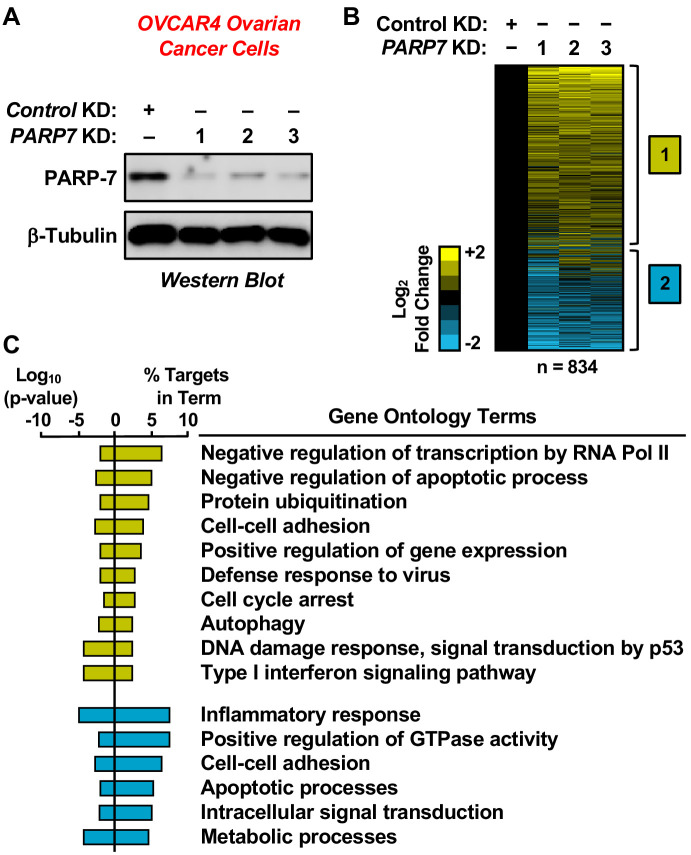
Figure 2. RNA-seq analysis of gene expression in ovarian cancer cells following PARP-7 depletion.
(A) Western blots showing PARP-7 protein levels after siRNA-mediated knockdown (KD) of PARP7 in OVCAR4 cells. Three different siRNAs were used. β-tubulin was used as loading control. (B) Heat maps showing the results of RNA-seq assays from OVCAR4 cells upon siRNA-mediated knockdown (KD) of PARP7. Three different siRNAs were used. Results represent fold changes in FPKM values for genes significantly regulated versus the control KD, expressed as log2 fold change. A fold change ≥1.5 was classified as upregulated, while a fold change ≤−0.5 was classified as downregulated. (C) Gene ontology terms enriched for the significantly upregulated genes (yellow) and significantly downregulated genes (blue) shown in (B). The percent of targets from each GO term identified in the analysis is shown, along with the log10 p-value for the enrichment.

