
Figure 3. Inferred naïve mAbs from six lineages vary in antigen binding capability and ADCC function.
(A–B) Binding kinetics of the inferred naive antibody (ligand) from each lineage to indicated concentrations of monomeric C.ZA.1197MB gp41 ectodomain (A) or BL035.W6M.C1 gp120 (B) (analyte). Best fitting lines (red) to a 1:1 binding model of ligand:analyte binding are shown. Data are representative of two independent experiments. (C) Positive control-normalized RFADCC activity of inferred naive antibodies compared to their respective mature antibodies. Normalization is described in Methods. Asterisks indicate indeterminate activity, as defined in Methods. Data are represented as mean ± SEM and reflect at least five independent experiments; source data are available in Figure 3—source data 1. 0: naive; m: mature. See Figure 3—figure supplement 1 for functional assessment of alternative naïve mAbs.
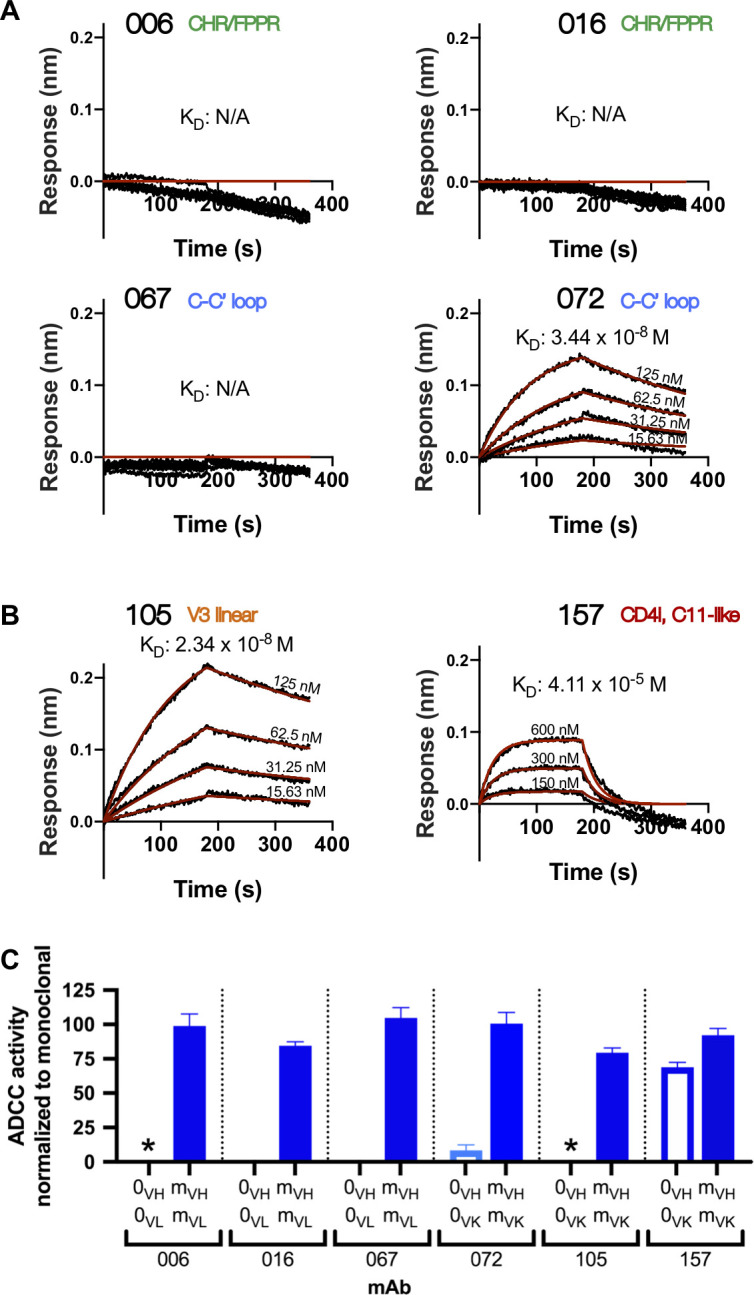
Figure 3—figure supplement 1. Alternative naive mAb functionality.
