
Figure 9. Lineage 105 epitope largely remains stable over time.
(A–B) Heatmaps depict scaled differential selection: the relative effect of each possible substitution within the V3 region of Env (HXB2 numbering), compared to wild type BG505.W6M.C2 Env, on binding by (A) 105 inferred naïve mAb and (B) 105 mature mAb. Wild-type residues are indicated by black dots. Mutations enriched above the wild-type residue are colored blue while those depleted are colored red; color intensity reflects the relative amount of differential selection as indicated by the key. Data are the average of two biological replicates. See also Figure 9—figure supplement 1 for peptide enrichment plots and Figure 9—figure supplement 2 for scaled differential selection in C.ZA.1197MB Env. Figure 9—source code 1 and Figure 9—source datas 1–3 contain fold enrichment and scaled differential selection data and calculations. (C) Logo plots of the residues comprising the 105 lineage epitope amongst 28 total longitudinal QA255 Env sequences (GenBank MW383929-MW383956) using HXB2 numbering.

Figure 9—figure supplement 1. Phage-DMS peptide enrichment for 105 inferred naive and 105 mature mAbs.
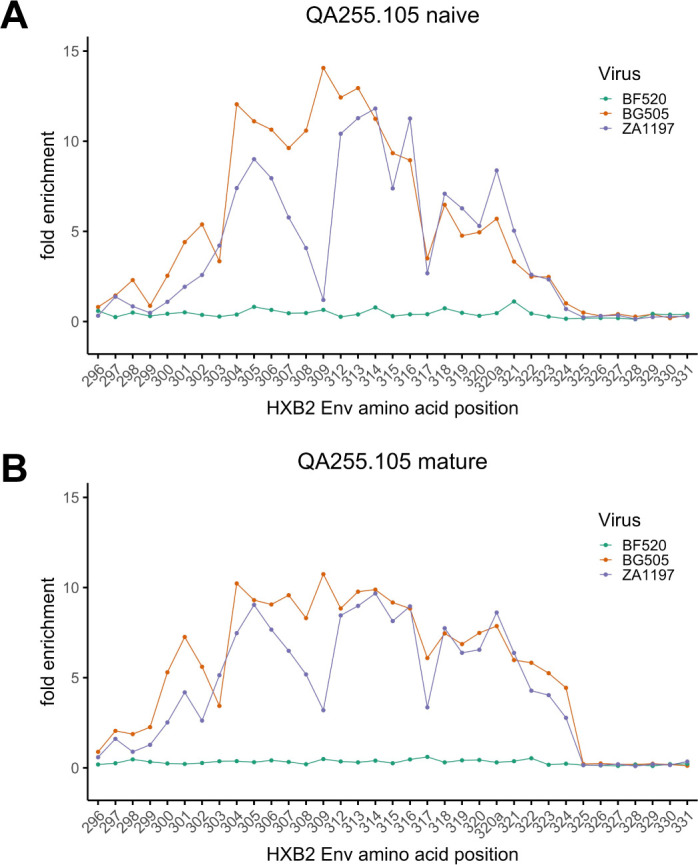
Figure 9—figure supplement 2. Lineage 105 epitope and predicted escape routes within C.ZA.1197MB Env.
