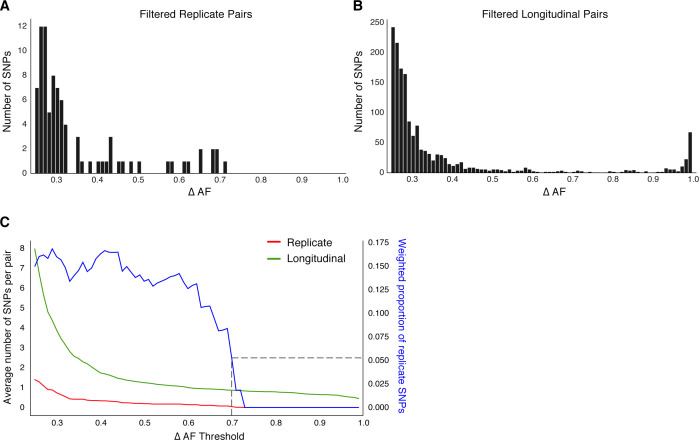
Figure 4. Replicate pairs reveal levels of biological noise associated with repeated sampling.
(A, B) We analyzed the distribution of ΔAF for all SNPs detected across all replicate pairs and longitudinal pairs for SNPs where ΔAF ≥25%. (B) SNPs were detectable at lower levels of ΔAF for both types of isolate pairs, but SNPs with higher values of ΔAF were only found in longitudinal pairs. (C) To determine a ΔAF threshold for calling SNPs representative of changes in bacterial population composition in-host, we calculated the average number of SNPs per pair of isolates at different ΔAF thresholds for both replicate and longitudinal pairs. At a ΔAF threshold of 70% the number of SNPs between replicate pairs represents 5.27% of the SNPs detected amongst all replicate and longitudinal pairs, weighted by the number of pairs in each group.

