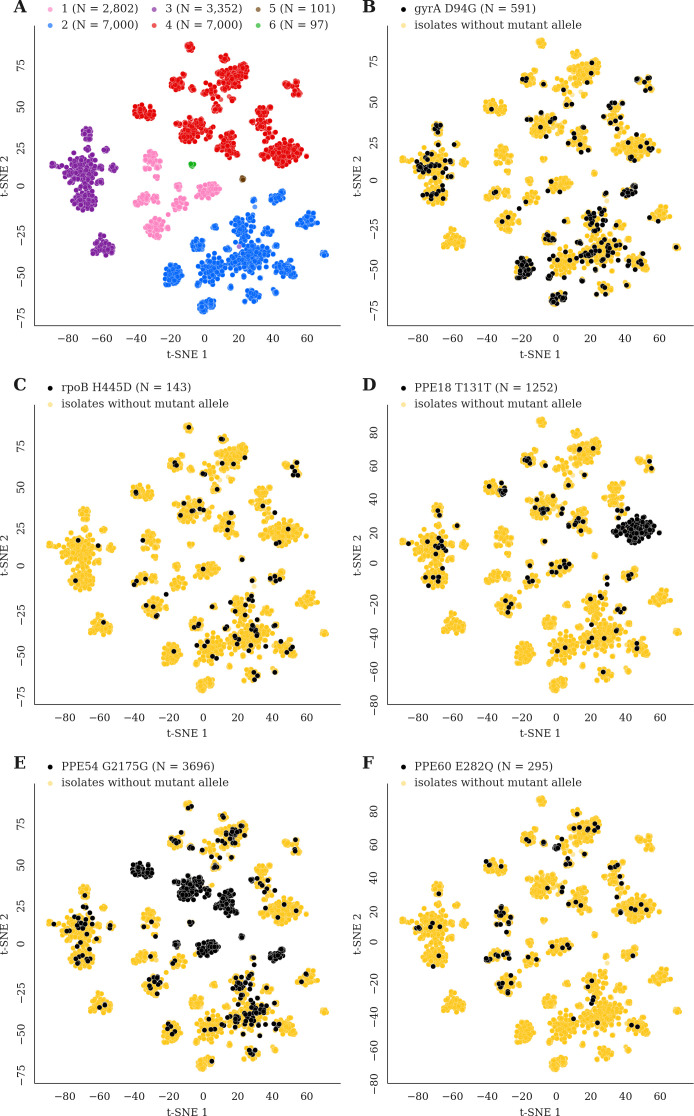
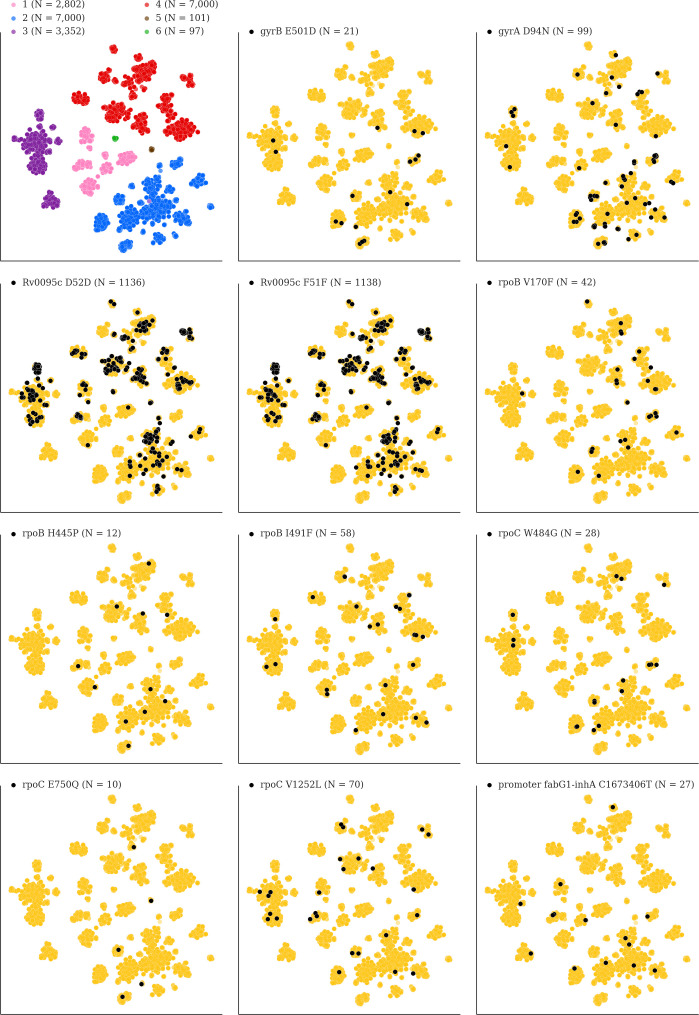
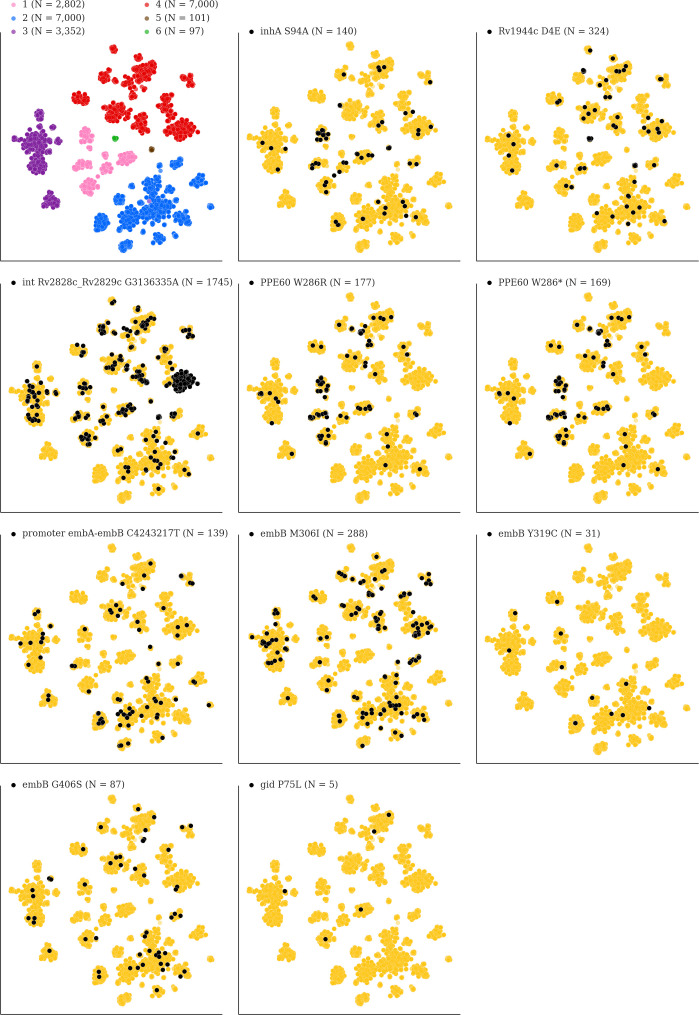
Figure 7. Mutations acquired in-host are phylogenetically convergent.
We constructed t-SNE plots from a pairwise SNP distance matrix for our global sample of 20,352 clinical isolates and 128,898 SNP sites (Materials and methods). (A) Labeling isolates by global lineage revealed that isolates cluster according to genetic similarity. Next, we labeled isolates by whether they carried a mutant allele that was also detected in-host. (B–F) Mutations in gyrA, rpoB, PPE18, PPE54, and PPE60 were detected in-host (Supplementary file 8), occur in a global collection of isolates (Supplementary file 18) and are scattered across the tSNE plots, indicating that they belong to genetically different clusters of isolates (Supplementary file 19). Furthermore, all mutations with a signal of phylogenetic convergence were detected in isolates belonging to different clusters, confirming that theses mutations must have arisen independently in different genetic backgrounds (Figure 7—figure supplements 1–2). Each plot is labeled with the gene name each mutation occurs within, amino acid encoded by the reference allele, H37Rv codon position, and amino acid encoded by the mutant allele. N = number of isolates with mutant allele.


