
Figure 1.
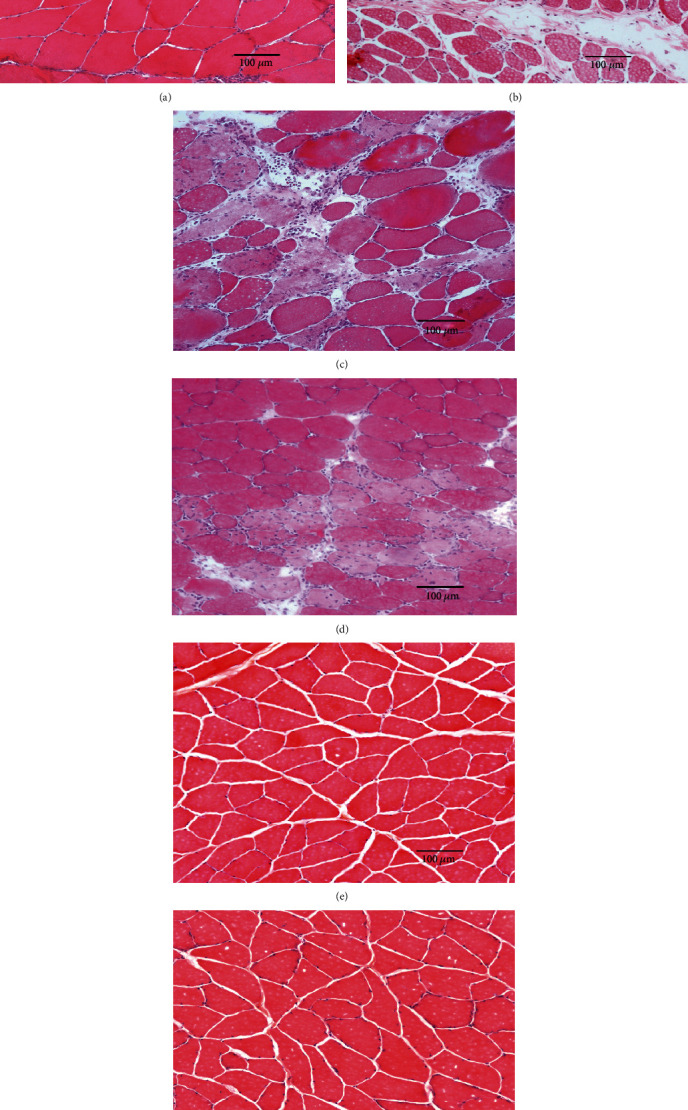
Hematoxylin and eosin staining of cross sections of the biceps femoris muscle. Scale bar = 100 μm. (a) Control group, (b) D0 group, (c) D7 group, (d) D7-20 Hz group, (e) D14 group, and (f) D14-20 Hz group.
Official websites use .gov
A
.gov website belongs to an official
government organization in the United States.
Secure .gov websites use HTTPS
A lock (
) or https:// means you've safely
connected to the .gov website. Share sensitive
information only on official, secure websites.
Hematoxylin and eosin staining of cross sections of the biceps femoris muscle. Scale bar = 100 μm. (a) Control group, (b) D0 group, (c) D7 group, (d) D7-20 Hz group, (e) D14 group, and (f) D14-20 Hz group.