
Figure 2.
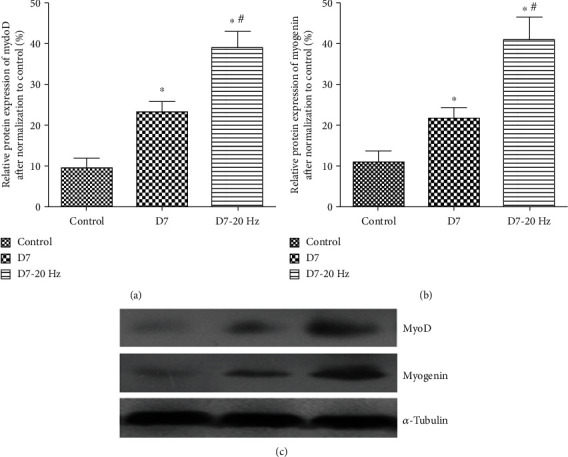
Western blot analysis of MyoD/myogenin protein expression at 14 days postinjury. Histogram (a, b: values are means ± SEM) and representative western blots (c) showing relative levels of MyoD/myogenin protein expression in biceps femoris muscles from control group, D14 group, and D14-20 Hz group rats (MyoD-specific band with molecular weight ~43–45 kDa, myogenin-specific band with molecular weight ~32–34 kDa, and α-tubulin-specific band with molecular weight 50 kDa). α-Tubulin was included as a loading control. ∗ indicates significant difference with the control (P < 0.05). # indicates significant difference with the D14 group (P < 0.05).