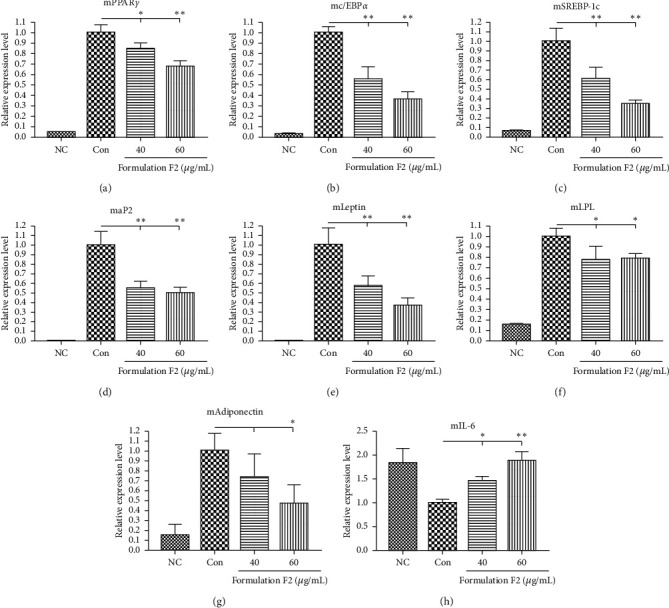
Figure 3.

Effects of F2 on the gene expression level of adipogenic transcription factors during adipocyte differentiation. (a) Peroxisome proliferator-activated receptor gamma (PPARγ), (b) CAAT/enhancer-binding protein alpha (C/EBPα), (c) sterol response element-binding protein-1c (SREBP-1c), (d) adipocyte protein 2 (aP2), (e) leptin, (f) lipoprotein lipase (LPL), (g) adiponectin, and (h) interleukin-6 (IL-6). Each gene's expression levels were quantified and normalized to β-actin. The data shown are presented as means ± SD of triplicate experiments. Statistical significance was calculated using one-way ANOVA followed by Dunnett's multiple comparisons test. ∗p < 0.05 and ∗∗p < 0.01 vs. control. NC: negative control (undifferentiated); Con: control (MDI).
