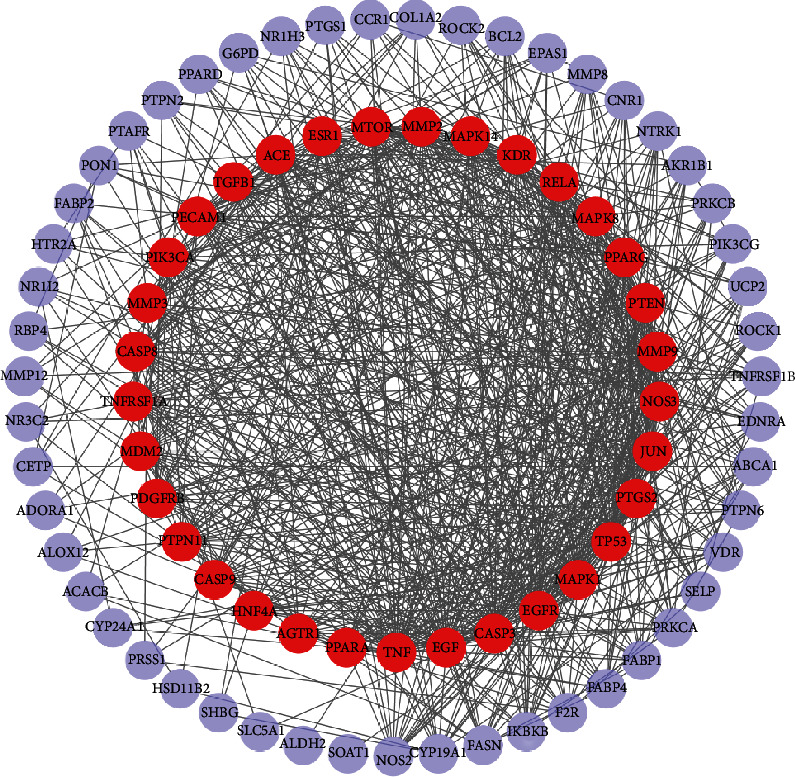
Figure 5.

PPI network integration and analysis. The red nodes display the most potential targets in treating DN, which are greater than the average degree. Also, the nodes in purple show the potential targets under the average degree. Furthermore, the density of lines among inner nodes indicates the interaction relationship between different protein targets.
