Figure 8.

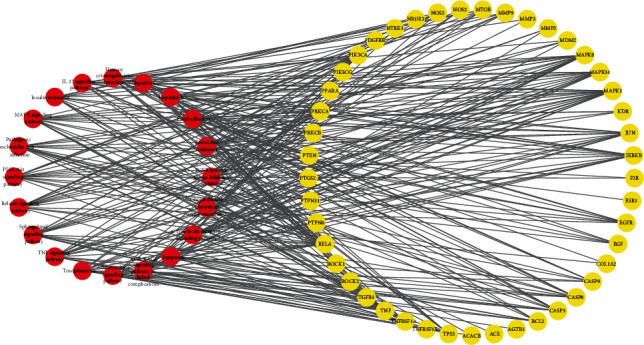
Pathway-target interaction network. Red circles indicate pathways which have interactions with potential targets, while the yellow circles represent putative targets.

Pathway-target interaction network. Red circles indicate pathways which have interactions with potential targets, while the yellow circles represent putative targets.