Figure 4.

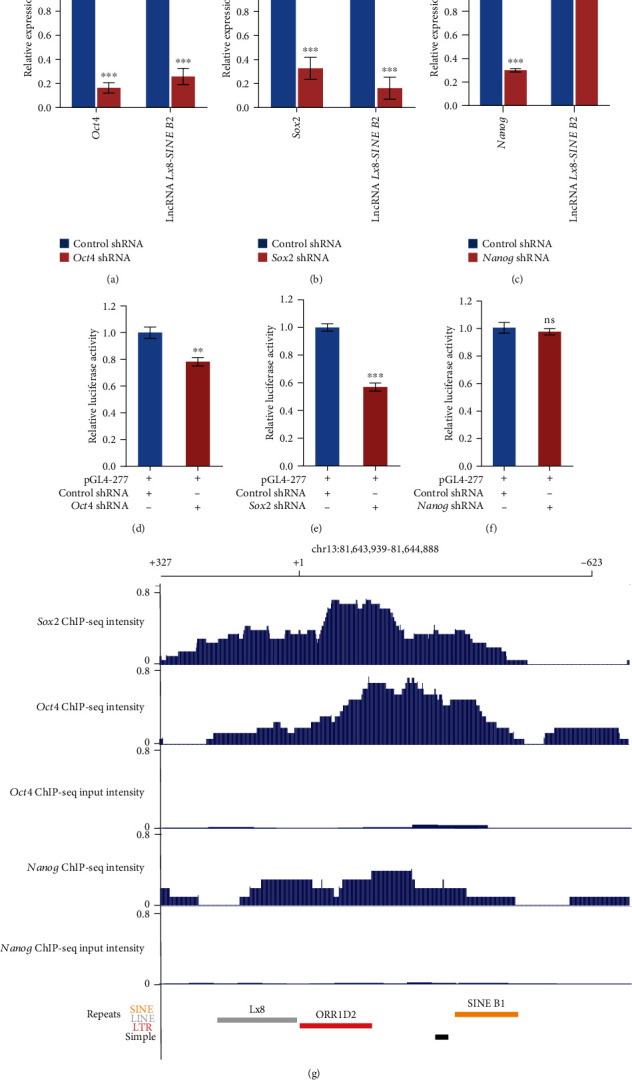
Oct4 and Sox2 drive the expression of lncRNA Lx8-SINE B2. (a–c) qPCR analysis of lncRNA Lx8-SINE B2 expression after depletion of core transcription factors Oct4 (a), Sox2 (b), and Nanog (c) in ESCs. The data are represented as mean ± s.e.m. from three biological replicates. ns, non-significant; ∗∗p < 0.01; ∗∗∗p < 0.001 according to two-sided Student's t-test. Biological-triplicate data (n = 3 dishes). (d–f) Luciferase assay analysis of core promoter activity of lncRNA Lx8-SINE B2 after depletion of core transcription factors Oct4 (d), Sox2 (e), and Nanog (f) in ESCs. Biological-triplicate data (n = 3 extracts) are presented as mean ± s.e.m. (g) Binding profile of Sox2, Oct4, and Nanog on the promoter region of lncRNA Lx8-SINE B2 according to published data as described in methods. Input was included as a control.
