
FIGURE 2.
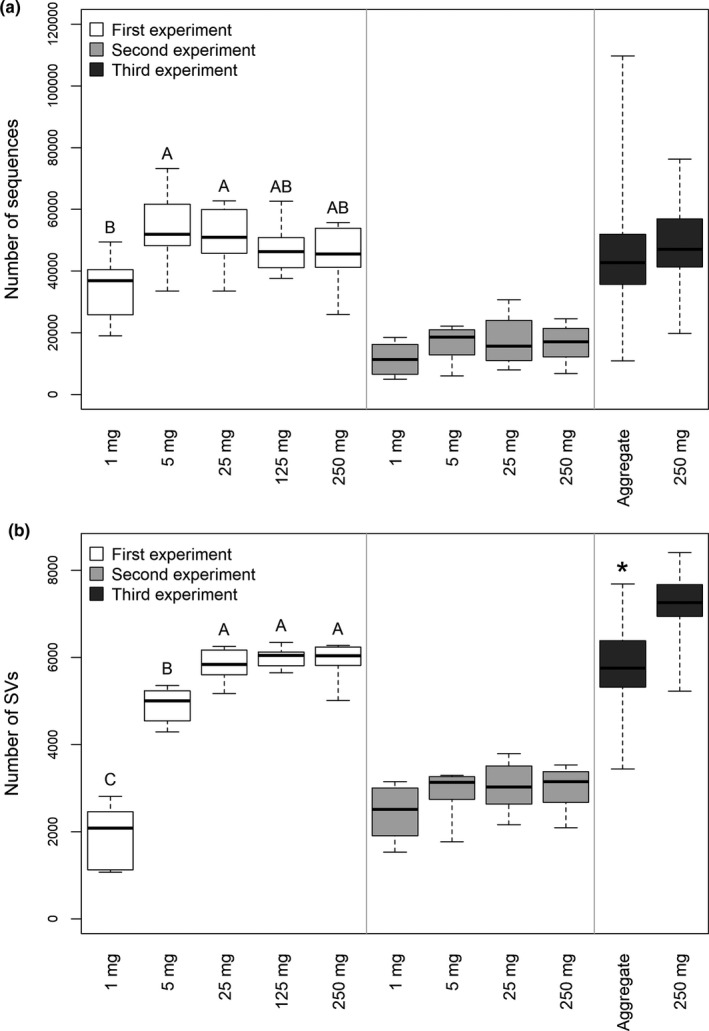
Number of (a) sequences and (b) sequence variants (SVs) in the samples after the removal of potentially contaminant SVs. Thick lines indicate the median values, the upper and lower hinges the 75th and 25th percentile, whiskers extend to the data extremes. Letters indicate significant differences between sample groups of the 1st experiment according to Tukey's HSD tests. * indicates a significant difference based on Welch's t‐test between the aggregate and the 250 mg soil samples of the 3rd experiment