FIGURE 3.

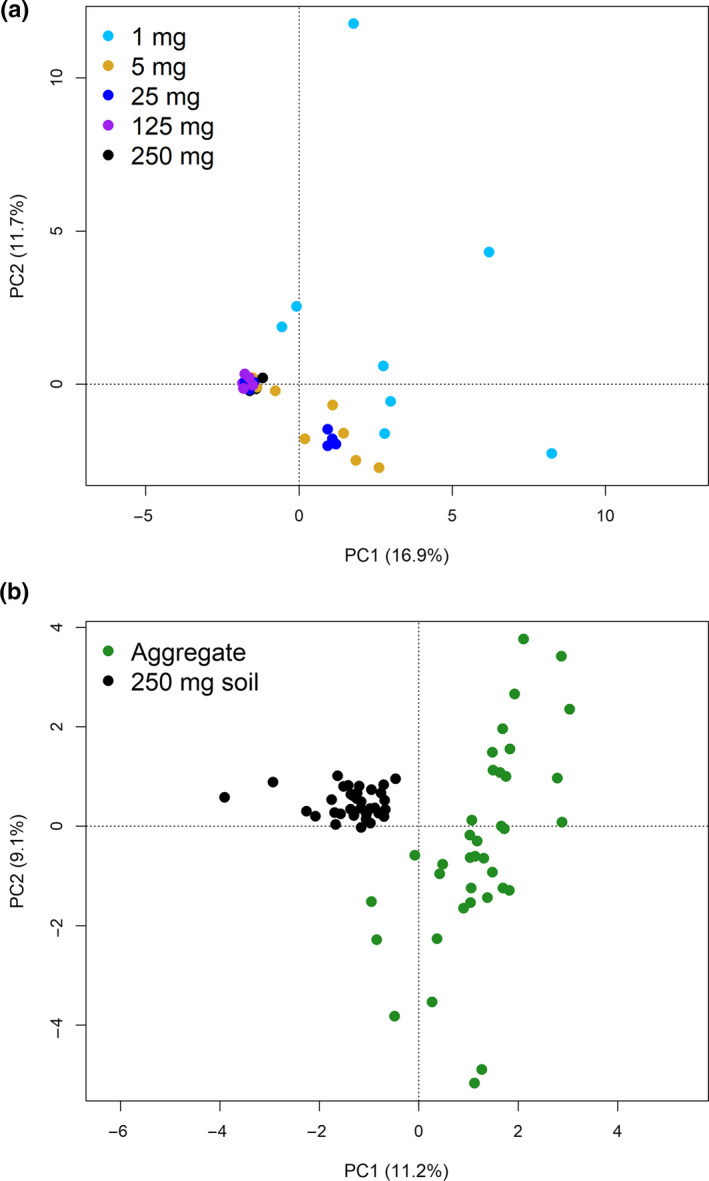
Principle component analyses (PCA) plots from the 16S rRNA gene sequencing data from the 1st (a) and 3rd (b) experiments

Principle component analyses (PCA) plots from the 16S rRNA gene sequencing data from the 1st (a) and 3rd (b) experiments