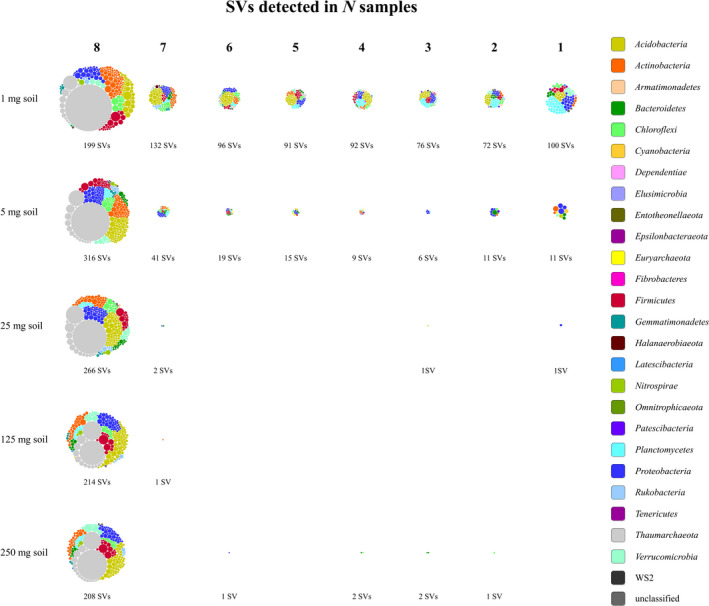
FIGURE 4.

SVs arranged according to how many of the 1, 5, 25, 125, or 250 mg samples from the 1st experiment they were detected in. Only SVs that reached at least 0.1% relative abundance in any of the samples are included. Each node represents one SV colored based on its phylum‐level classification and sized according to its average relative abundance across all samples excluding those in which it was not detected
