FIGURE A1.

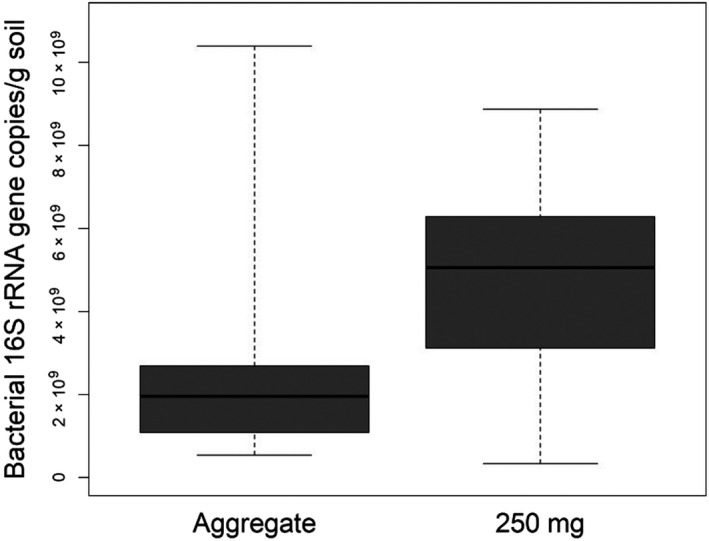
Estimates of bacterial abundance in a gram of soil from the samples of the 3rd experiment based on qPCR. Thick lines indicate the median values, the upper and lower hinges the 75th and 25th percentile, whiskers extend to the data extremes

Estimates of bacterial abundance in a gram of soil from the samples of the 3rd experiment based on qPCR. Thick lines indicate the median values, the upper and lower hinges the 75th and 25th percentile, whiskers extend to the data extremes