
Figure 1.
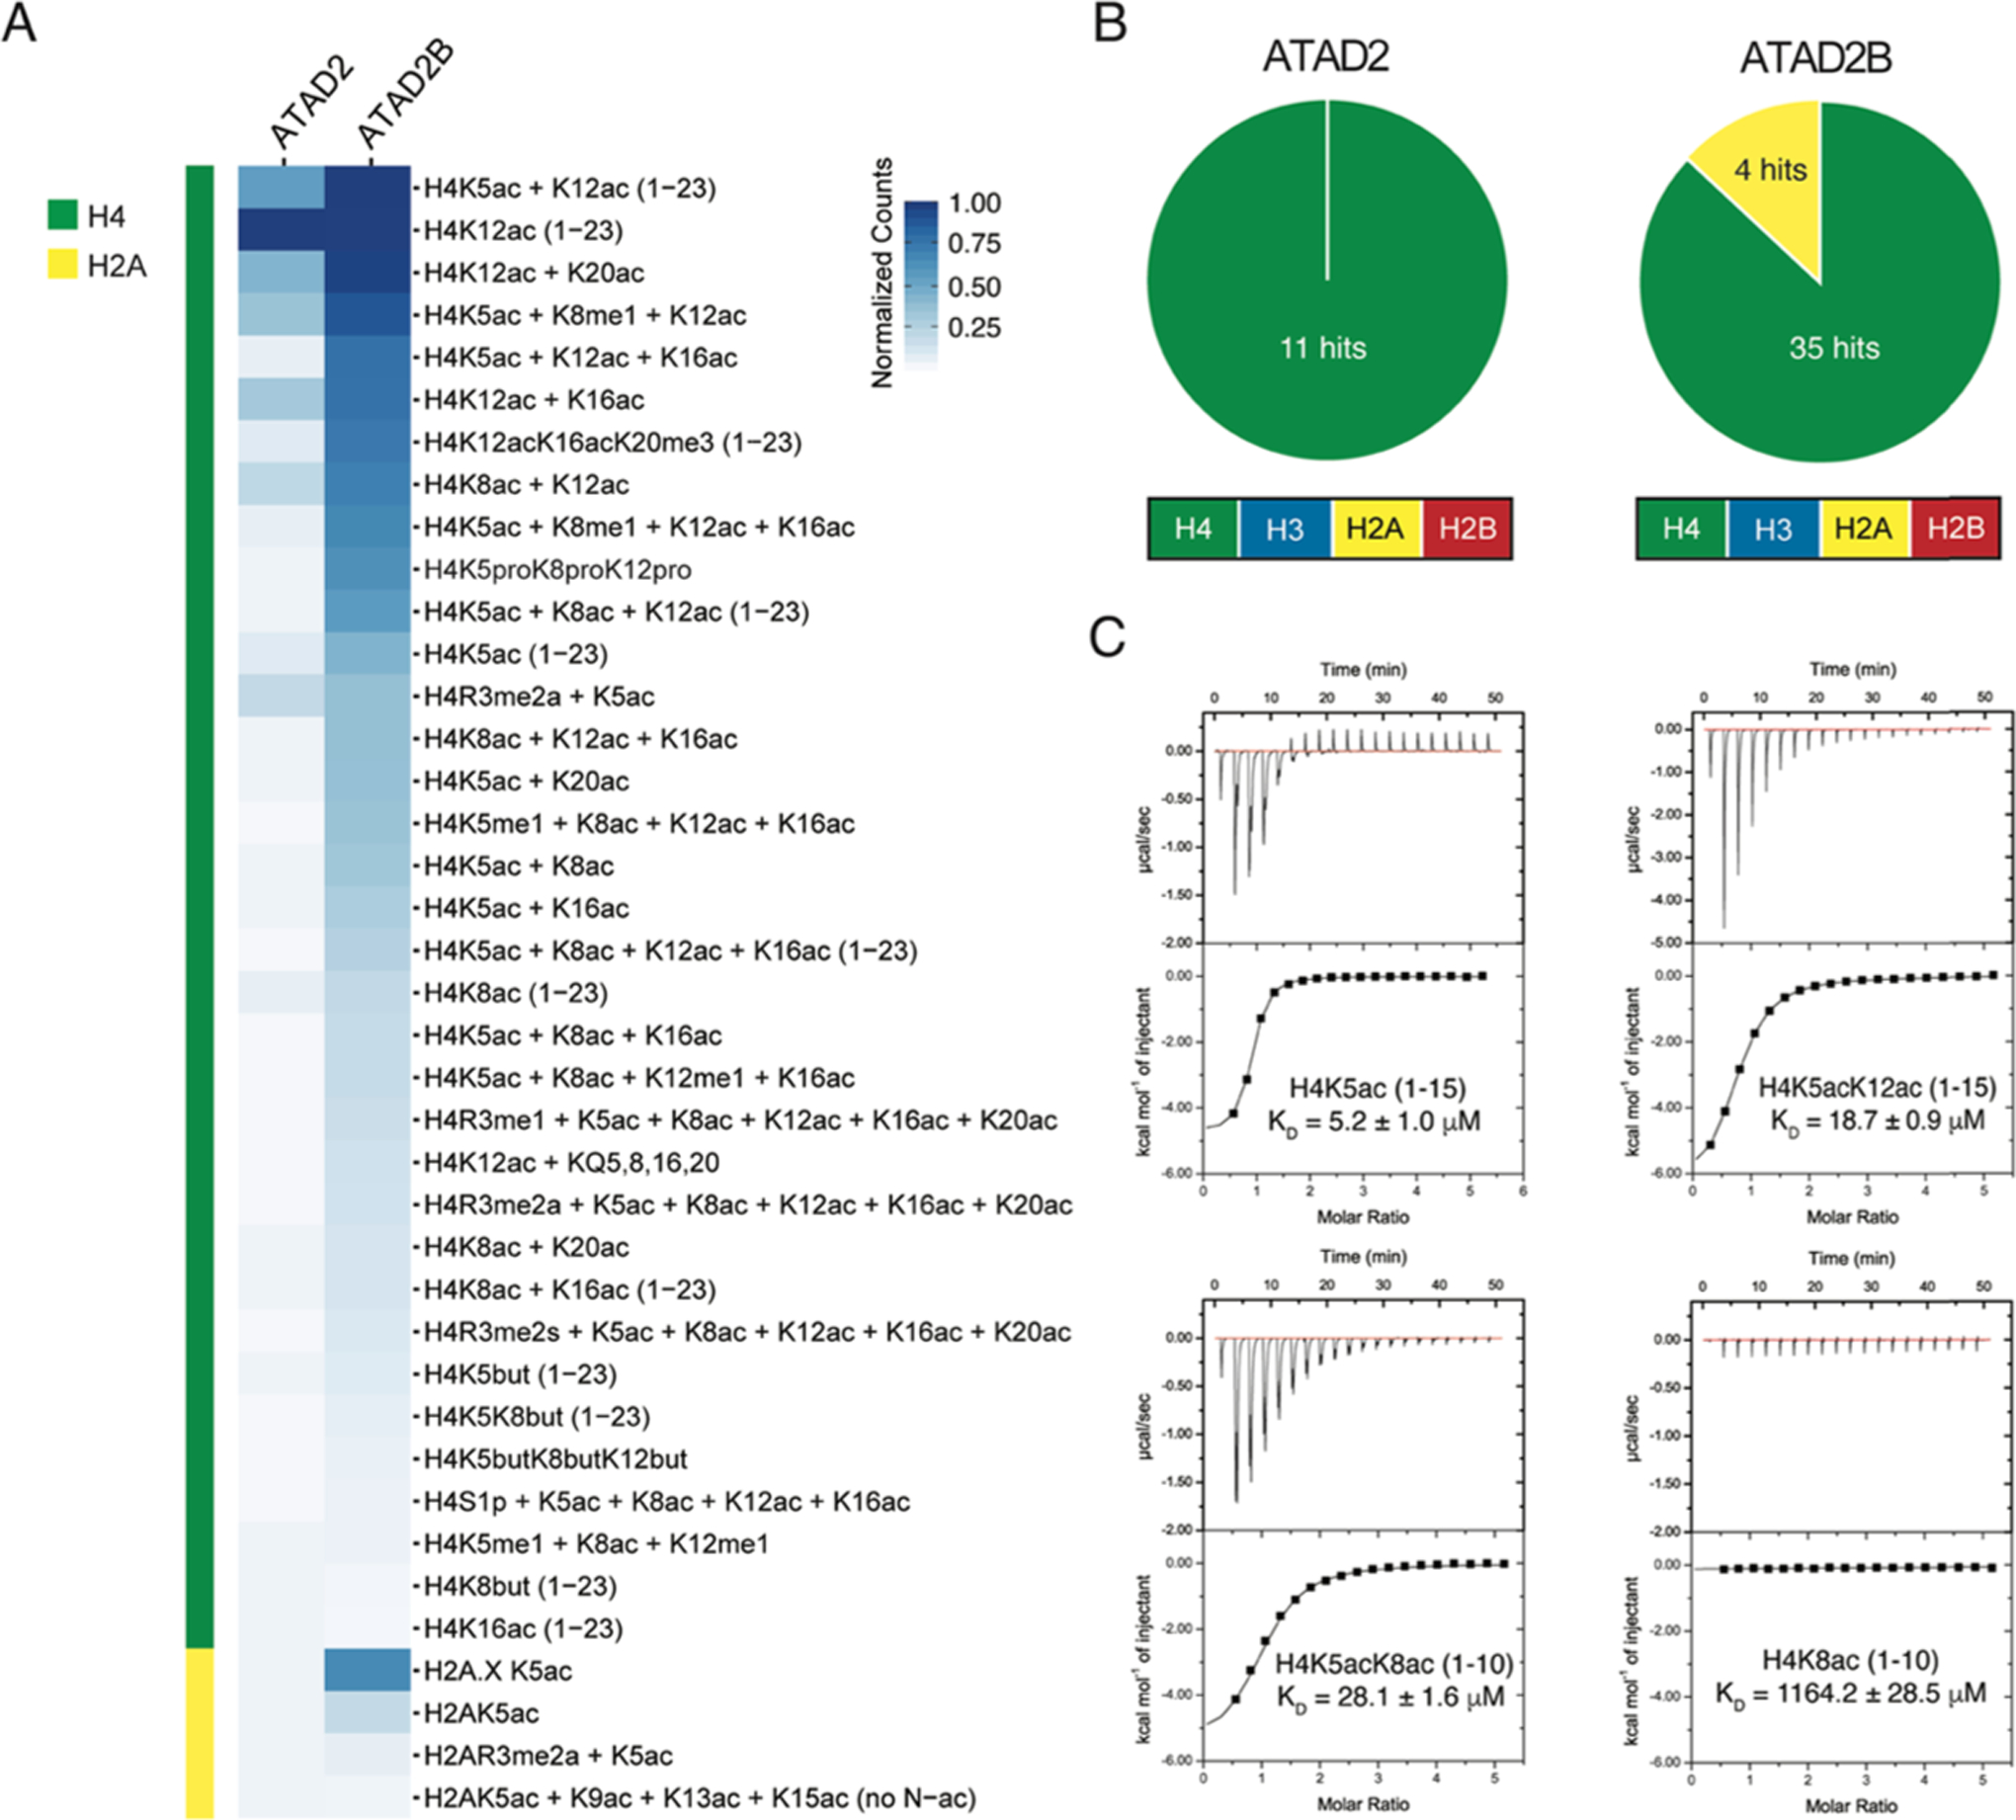
ATAD2B bromodomain recognizes acetylated histones. (A) Heat map represents the relative binding of GST-tagged ATAD2 and ATAD2B bromodomains to histone peptides using AlphaScreen technology (i.e., dCypher phase B: see the Methods section). α counts (n = 2) were normalized for each protein to the highest fluorescent intensity signal for each respective assay, and the relative binding strength is indicated by the color gradient. (B) Pie charts for ATAD2/B bromodomains indicate the number of peptides classified as positive binders (α counts having signals >5000, which is at least twice that of the relevant unmodified control peptide) (full dCypher peptide screen data in Tables S1 and S2, and Resources Table A). (C) Exothermic ITC enthalpy plots for the binding of the ATAD2B bromodomain to mono- and diacetylated histone ligands. The calculated binding constants are indicated.