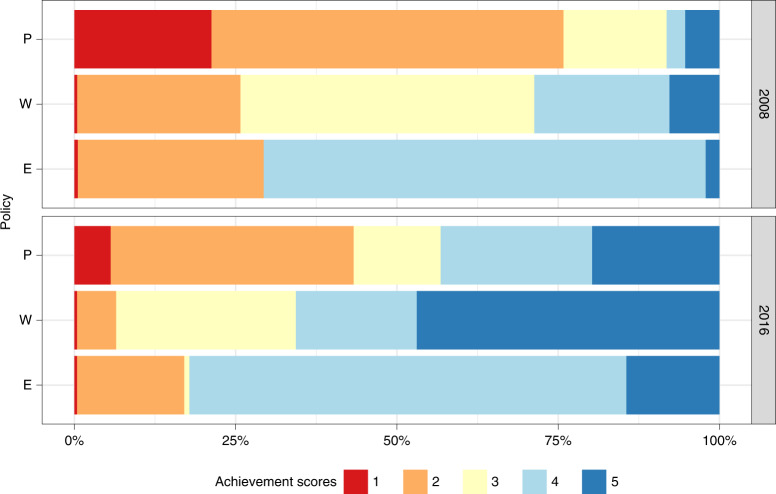
Fig. 1. Level of coverage of the population aged 15 years and older by comprehensive smoke-free, health warning and advertising policies in 2008 and in 2016.
To assess national-level legislation quality, the WHO attributes a score to each MPOWER component that ranges from 1 to 5 for smoke-free (P), health warning (W) and advertising (E) policies. A score of 1 represents no known data or no recent data, while scores 2–5 characterize the overall strength of each policy, from 2 representing the lowest level of achievement (weakest policy), to 5 representing the highest level of achievement (strongest policy).

