FIGURE 7.
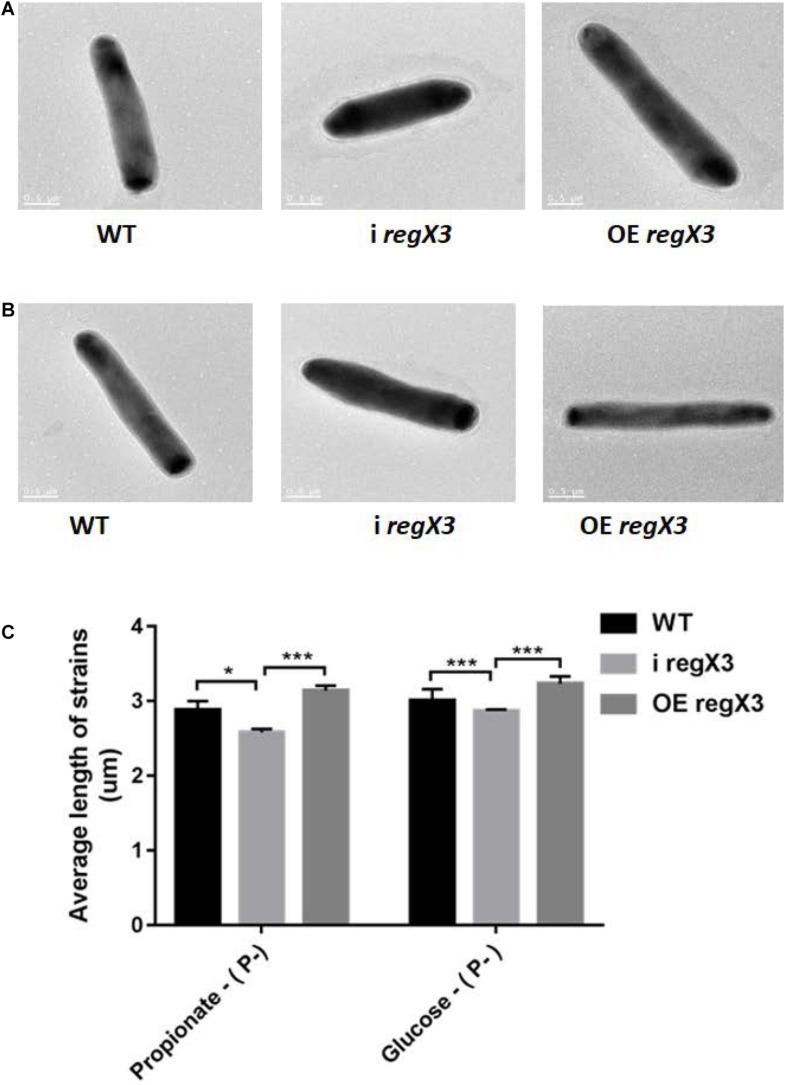
The morphology of three M. smegmatis strains growing on different carbon resources in response to phosphate starvation. Transmission electron microscopy (TEM) images of single bacillus from M. smegmatis WT, i regX3, and OE regX3 strains after incubated for 12 h in the 10 mM MOPS-propionate (A), or the 10 mM MOPS-glucose (B) minimal medium with a low concentration of phosphate (100 μM K2HPO4). Scale bar represents 0.5 μm. See also Supplementary Figures 5A,B. (C) Length of bacteria cells (n = 30) as shown in Figure S5A and S5B was measured by manual evaluation, using Image J on the electron microscopic images. Data are presented as means ± SEM. Unpaired two-tailed Student’s t-test, *p < 0.05 and ***p < 0.001.

