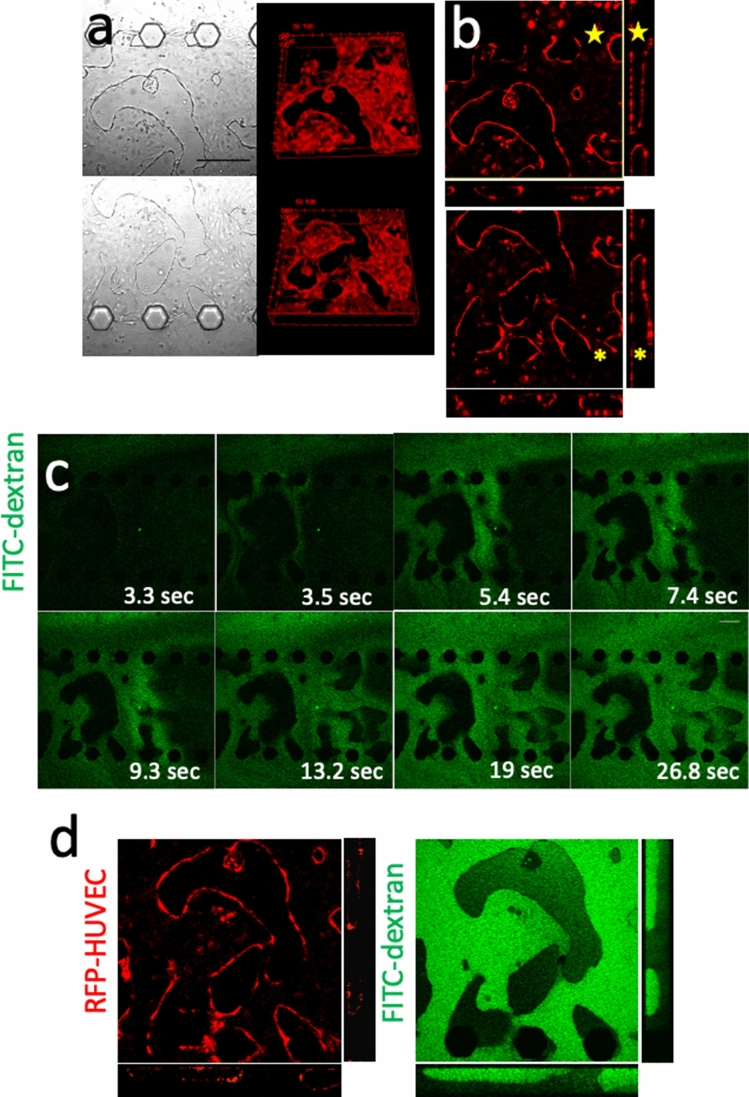
Fig. 5.
Evaluation of lumen formation in the 5-lane assay. a Bright-field views of lane #3 on day 7 showing vascular network formation of HUVECs (upper: Lane #2-#3 boundary, lower lane #3-#4 boundary) (scale bar = 200 μm). The corresponding views of three-dimensional reconstructed fluorescent images revealing luminal structures. b Z-stack and orthogonal views from the confocal microscope demonstrating luminal structures penetrating through lane #3 (⋆). c Time-lapse images after injection of fluorescein isothiocyanate (FITC)-dextran into lane #2 showing immediate perfusion to lane #4 through the luminal structure of HUVECs. The elapsed times (ms) after injection are shown for each photo (scale bar = 200 μm). d High magnification (× 20) Z-stack and orthogonal views from the confocal microscope after perfusion showing dextran filling lumens (Left: RFP-HUVEC, right: FITC-dextran)

