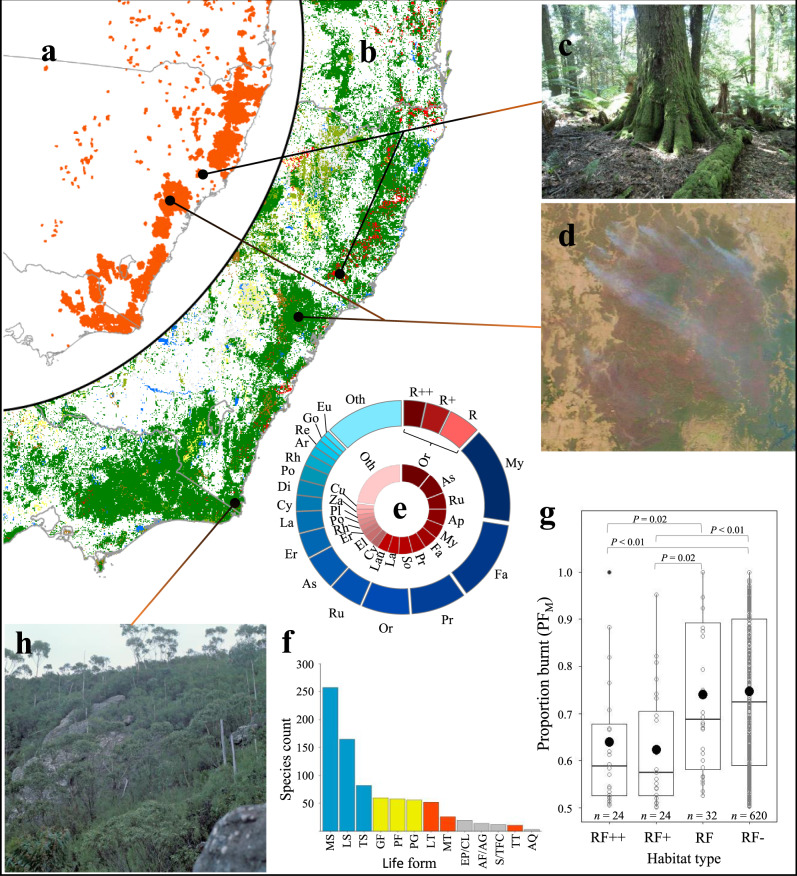
Fig. 2. Landscape-scale implications of the 2019–2020 bushfires.
a Extent of 1 July 2019–11 February 2020 fires. b Broad vegetation types in south-eastern Australia; red = Rainforest and Vine Thickets, green = Eucalypt Forest and Woodland, brown = Shrublands and Heathlands, yellow = Grasslands, Herblands, Sedgelands, Rushlands and olive = Other Forests and Woodlands. c Cool temperate rainforest at Barrington Tops, NSW. d Active fires in the Wollemi megafire on 4 January 2020 with burnt areas and refugia clearly visible. e Taxa affected by family and rainforest habitat type (RF + + = rainforest, RF + = semi-rainforest, RF = rainforest margins, all others = non rainforest = RF−). The inner pie chart contains data only for RF + + , RF + and RF species. Ap = Apocynaceae, Ar = Araliaceae, As = Asteraceae, Cu = Cunoniaceae, Cy = Cyperaceae, Di = Dilleniaceae, El = Elaeocarpaceae, Er = Ericaceae, Eu = Euphorbiaceae, Fa = Fabaceae, Go = Goodeniaceae, La = Lamiaceae, Lau = Lauraceae, My = Myrtaceae, Or = Orchidaceae, Pl = Plantaginaceae, Po = Poaceae, Pr = Proteaceae, Re = Restionaceae, Rh = Rhamnaceae, Ru = Rutaceae, So = Solanaceae, Za = Zamiaceae, Oth = other. f Number of species by life form type; MS = medium shrubs, LS = low shrubs, TS = tall shrubs, GF = geophytic perennial forbs, PF = other perennial forbs, PG = perennial graminoids, LT = low trees, MT = medium trees, EP/CL = epiphytes and climbers, AF/AG = annual forbs and grasses, S/TFC = short and tall ferns and cycads, TT = tall trees, AQ = aquatic (full descriptions in ‘Methods’). Blue = shrubs, orange = trees, yellow = perennial forbs and graminoids, and grey = other groups. g Proportion burnt (PFM) of endemic rainforest (RF++), semi-rainforest (RF+), rainforest margin (RF) and non-rainforest (RF-) species. Species counts are shown below data for each habitat type. The middle and lower and upper hinges of each boxplot correspond to the median and first and third quartiles, respectively, while whiskers extend to the largest value no further than 1.5 times the interquartile range. Data points are shown as small circles with outliers filled in black; habitat group means are shown as large black circles. Overall group differences were significant (Kruskal–Wallis χ2 = 24.5, df = 3, P < 0.001); significant pairwise group differences (P < 0.05) based on two-tailed Wilcoxon rank-sum tests are shown at the top of the panel. h Stand of the rare, endemic mallee-forming Eucalyptus imlayensis on Mount Imlay, south coast NSW. Images by (c) M.Fagg, (d) NASA’s Worldview Snapshots application (https://wvs.earthdata.nasa.gov), part of the Earth Observing System Data and Information System, and (h) M.Crisp. ©Australian National Botanic Gardens, 1978.

