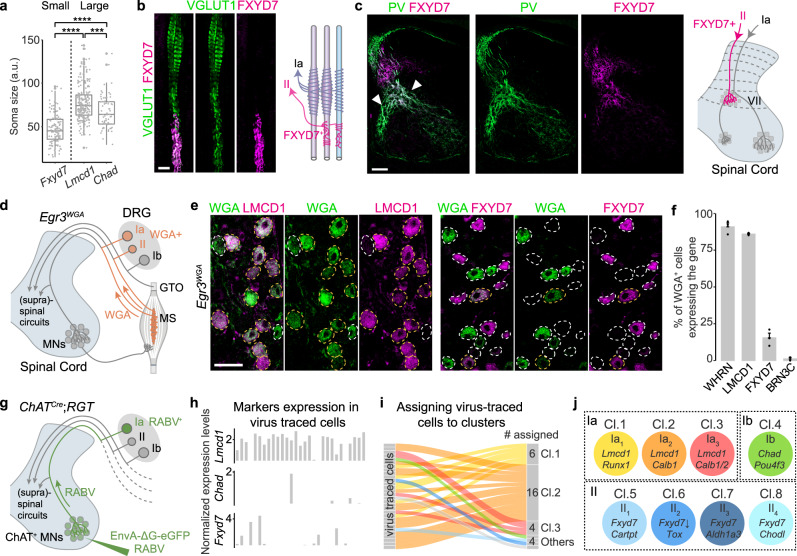
Fig. 2. Identification of the major PN types.
a Quantification of cross-nucleus soma sizes of the three major PN populations depicted in box and whisker plot. Lower and upper hinges: first and third quartiles; the horizontal line: median; the whiskers extend to the value no further than 1.5 * IQR from the hinge; large dots: outliers. Each dot represents a cell: Fxyd7+ PNs (n = 124 cells), Lmcd1+ PNs (n = 227 cells), Chad+ PNs (n = 69 cells). Two-tailed t-test, ****p < 0.0001, ***p < 0.001. b Longitudinal section of muscle spindle (MS) stained for VGLUT1 and FXYD7. Scale bar: 20 µm. Right panel: schematic depiction of the finding. c Transverse section of P4 spinal cord stained for PV and FXYD7. Scale bar: 100 µm. Right panel: schematic depiction of the finding. d Genetic strategy to label MS-innervating PNs in Egr3WGA mice. e Representative image showing co-labeling of DRG neurons by WGA and LMCD1 or FXYD7 in DRG sections from P14 Egr3WGA mice. Scale bar: 50 µm. f Quantification of WGA+ cells expressing WHRN, LMCD1, FXYD7, and BRN3C, respectively, in P14 brachial DRG (n = 3 animals). Data are presented as mean ± SEM; dots represent values from individual animals. g Trans-monosynaptic rabies virus tracing strategy to label Ia-PNs in adult ChATCre;RGT mice. h Bar plots showing that the majority of the rabies virus infected PNs express Lmcd1 but not Fxyd7 or Chad. i Assignment of virus infected PNs to the identified eight PN clusters based on their overall transcriptomic similarity. j A summary of correspondence between the known functional types of PNs and the cell clusters identified by scRNAseq. Source data are provided as a Source Data file.

