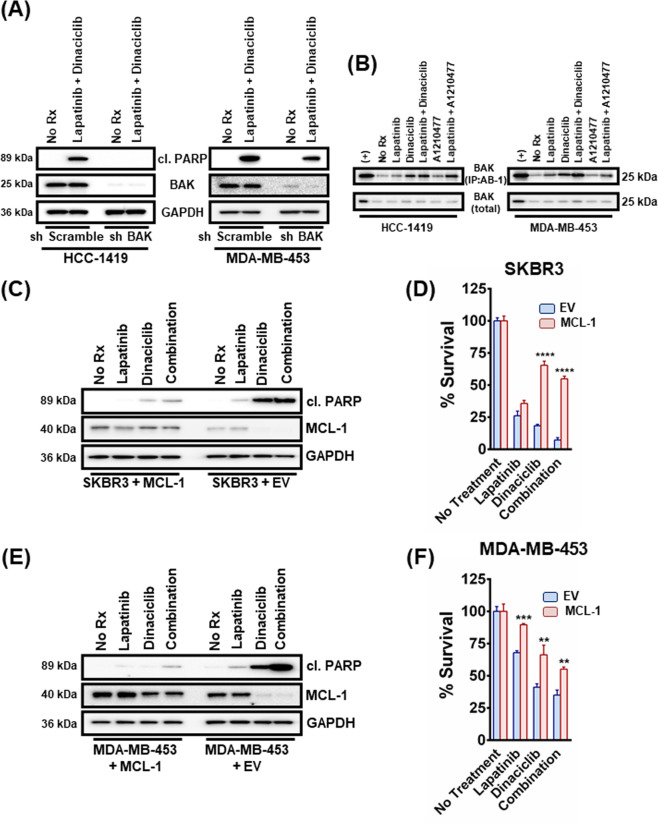
Fig. 2. BAK is required for dinaciclib-induced cell death in HER2-amplified breast cancer cells and dinaciclib functions mainly by inhibiting MCL-1.
A HCC-1419 and MDA-MB-453 cells were transduced with lentiviruses containing plasmids with an shRNA sequence targeting BAK or a non-targeting control. Puromycin-resistant cells were pooled after each infection. Cells were then treated with no drug, 1 μM lapatinib, 100 nM dinaciclib or their combination overnight. Cell lysates were prepared and subjected to western blotting and probed for cleaved PARP, BAK, and GAPDH (‘’No Rx”: No drug). B HCC-1419 and MDA-MB-453 cells were treated with no drug, 1 μM lapatinib, 100 nM dinaciclib, 10 μM A1210477 and their combinations (lapatinib/dinaciclib and lapatinib/A1210477) overnight and CHAPS lysates (using the zwitterionic detergent CHAPS, that can solubilize cells without promoting significant conformational changes in BAX and BAK, including the N-terminal Bak epitope exposure recognized by antibody Ab-1) were prepared and subjected to AB-1 IP and western blotting. Total cell lysates were analyzed in parallel. C SKBR3 control or MCL-1-expressing cells were treated with 1 μM lapatinib, 100 nM dinaciclib, and their combination for 12 h. Whole-cell lysates were prepared, subjected to western blotting and probed for the indicated proteins. D SKBR3 control or MCL-1-expressing cells were treated with 1 μM lapatinib, 100 nM dinaciclib, and their combination for 12 h and subjected to CellTiter-Glo. n = 3; error bars indicate ±SD. E MDA-MB-453 control or MCL-1-expressing cells were treated with 1 μM lapatinib, 100 nM dinaciclib, and their combination for 12 h. Whole-cell lysates were prepared, subjected to western blotting and probed for the indicated proteins. F MDA-MB-453 control or MCL-1-expressing cells were treated with 1 μM lapatinib, 100 nM dinaciclib and their combination for 72 h and subjected to CellTiter-Glo. n = 3; error bars indicate ±SD. For Fig. 2D, F two-tailed Student’s t test was performed. p values were corrected for multiple testing using the Bonferroni method. Differences were considered statistically different if p < 0.05. A p value < 0.05 is indicated by *, p < 0.01 by **, p < 0.001 by ***, and p < 0.0001 by ****. EV: empty vector, (+): positive control, CHAPS: 3- ((3-cholamidopropyl)dimethylammonio)-1-propanesulfonic acid.

