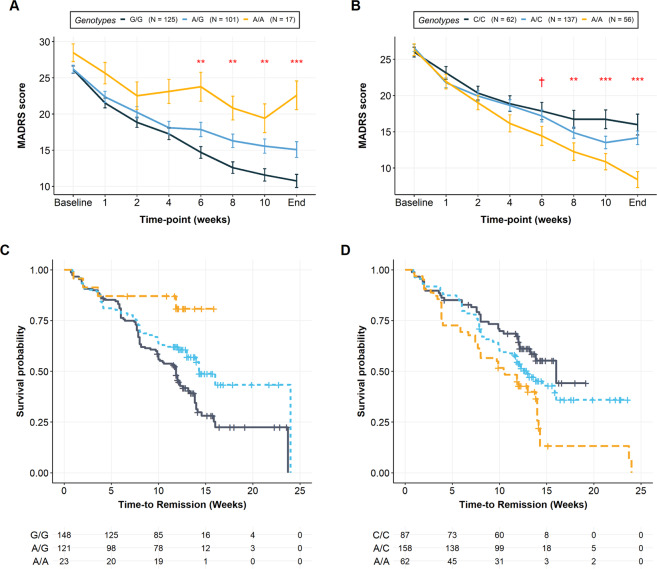
Fig. 3. Secondary analysis results for top-associated SNPs, rs6916777 (chr6:25251374:C:A) and rs12597726 (chr16: 88820301:G:A).
A, B Mixed-effects analyses for rs6916777 and rs12597726, respectively. Values at each time-point denote mean per genotype, and error bars denote standard error of the mean. C, D Kaplan–Meier survival plots for rs6916777 and rs12597726, respectively. Risk tables denote the number of non-remitted or censored individuals at each time-point. Significance levels. ***p < 0.001, **p < 0.01, *p < 0.05, †p < 0.1.

