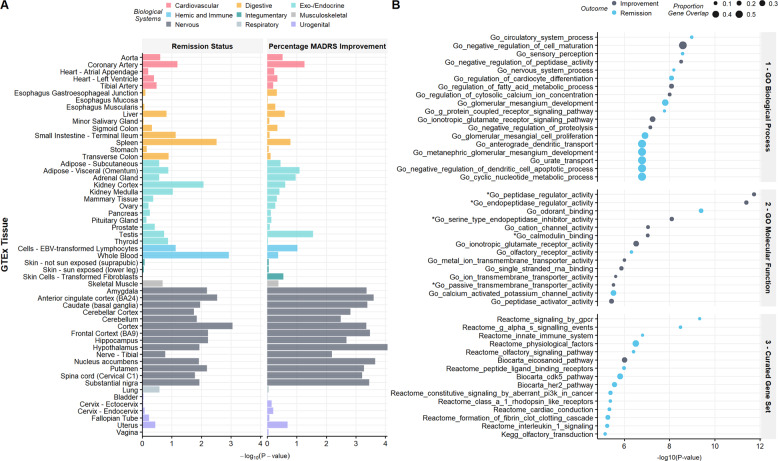
Fig. 4. GTEx tissue and geneset enrichment for nominally associated genes with remission status (n = 878) or percentage symptom improvement (n = 889).
A GTEx tissue (n = 54) enrichment. B Enrichment across Gene Ontology and curated genesets. For genesets, only the top 15 sets are shown across both remission status and percentage symptom improvement for brevity. No significant enrichment was observed for tissue or genesets. *Note. Pathways also among the top 15 associated for the second phenotype (either remission status or improvement, as indicated) but at a lower p-value.

