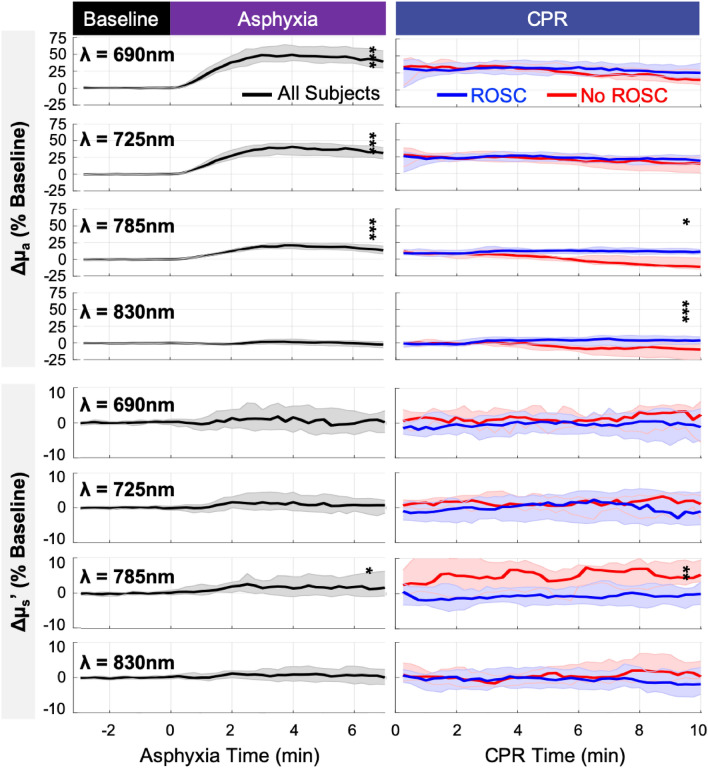
Figure 2.
Changes in Optical Absorption (µa) and Scattering (µs′) Properties during Asphyxia (left) and CPR (right): Shown are the median (thick line) and interquartile range (shaded) of the measured changes during asphyxia (all subjects, black) and during CPR (ROSC, blue; No-ROSC, red), expressed as a percentage (%) of baseline. Significant increases in µa at 690, 725, and 785 nm and µs′ at 785 nm were observed at the end of asphyxia. In the 10th minute of CPR, the change in µa at 785 and 830 nm from baseline was significantly greater in ROSC versus No-ROSC subjects, however change in µs′ at 785 nm was significantly greater in No-ROSC versus ROSC subjects (*, p < 0.05; **, p < 0.01; ***, p < 0.001).

