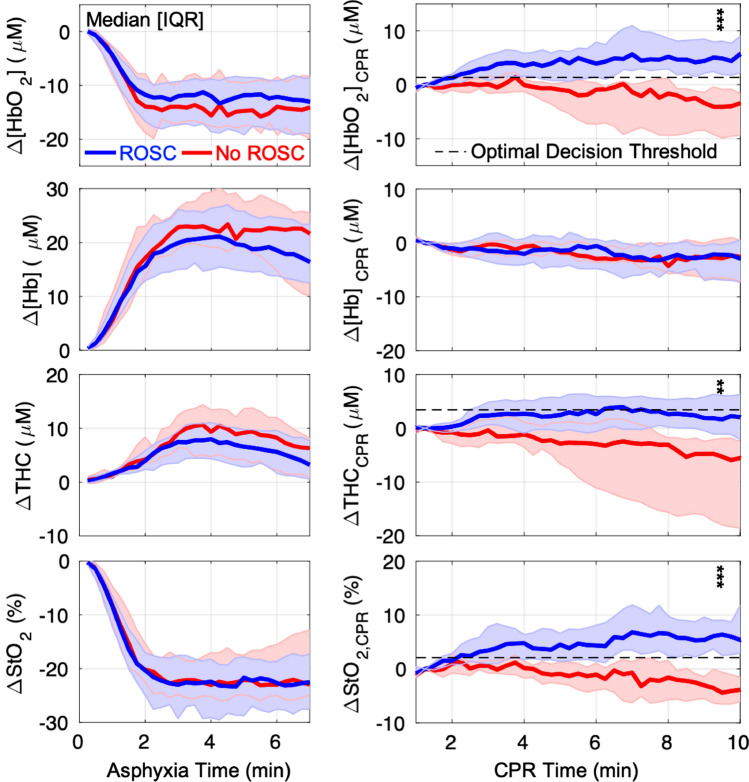
Figure 3.
Changes in Cerebral Hemodynamics during Asphyxia and CPR: The changes in cerebral oxy-hemoglobin concentration (Δ[HbO2]; first row), deoxy-hemoglobin concentration (Δ[Hb]; second row), total hemoglobin concentration (ΔTHC; third row) and tissue oxygen saturation (ΔStO2; bottom row) from baseline during asphyxia (left), and from 1-min of CPR during CPR (right), are summarized and grouped by CPR outcome (ROSC, blue; No ROSC, red). Data are plotted as median (thick solid line) and interquartile range (IQR; thin solid line). The optimal decision threshold for ROSC are also plotted (dotted line) for Δ[HbO2]CPR (+ 1.3 µmol/L), ΔTHCCPR (+ 3.4 µmol/L), and ΔStO2,CPR (+ 2.1%). In the 10th minute of CPR, association with ROSC was assessed by Wilcoxon Rank-Sum test (**, p < 0.01; ***, p < 0.001).

