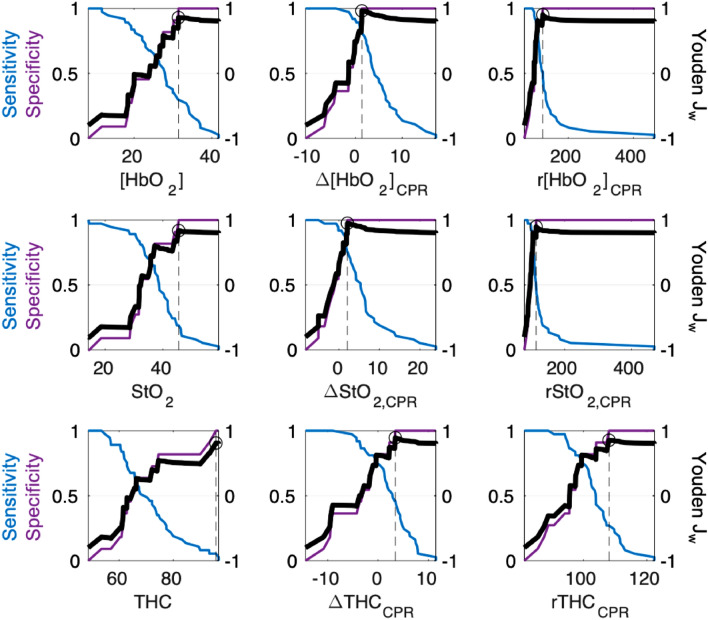
Figure 4.
Selection of Optimal Predictor and Decision Threshold Based on Maximum Weighted Youden Index (Jw): From the mean value from 2 to 10 min of CPR, the optimal decision threshold was selected by maximum ROSC prediction performance, as assessed by the weighted Youden index (Jw). For each parameter, the sensitivity (blue, left y-axis) and specificity (purple, left y-axis) for ROSC, and the calculated Youden Jw (bold black line, right y-axis) are plotted for all possible threshold values (x-axis). The parameter-specific maximum Jw is highlighted by a circle with a dotted line drawn to the corresponding threshold value on the x-axis; these values are listed in Table 3. Δ[HbO2]CPR achieved the highest Jw (0.96) overall; this corresponds to a decision threshold of + 1.3 µmol/L.

