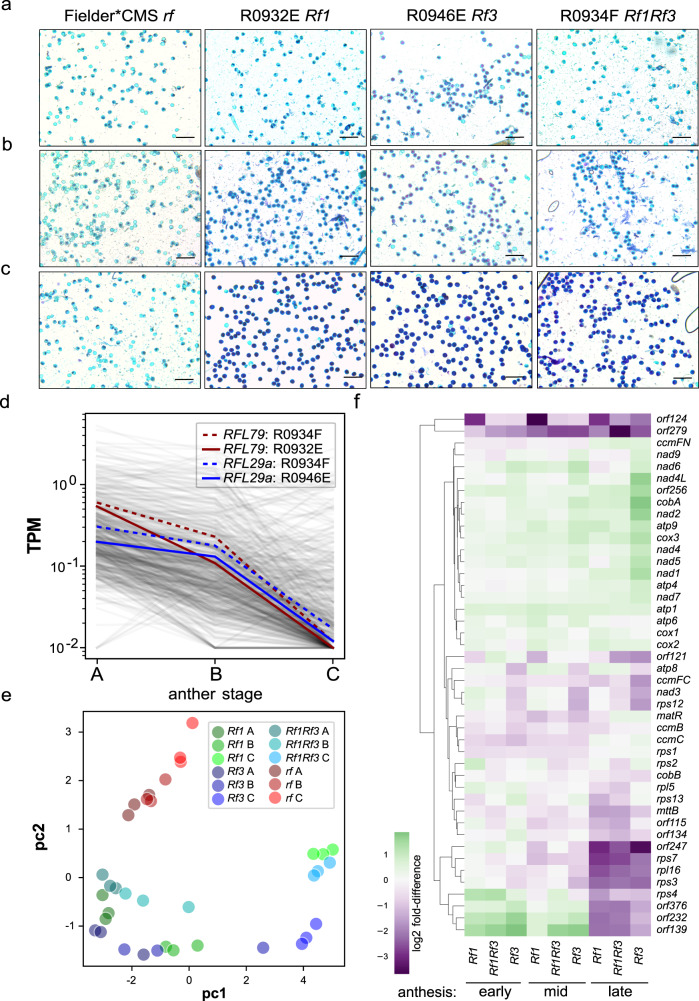
Fig. 2. Expression profiles of nuclear and mitochondrial genes in fertile and sterile wheat genotypes during anther development.
Alexander’s staining of viable and non-viable pollen grains from anthers collected at three developmental stages: early heading (a), early/mid anthesis (b) and late anthesis (c). Scale bar = 200 μm. This experiment was performed twice. A representative from 20 micrographs for each genotype is shown. d Expression profile of RFL genes in three wheat genotypes: R0932E carrying Rf1, R0946E carrying Rf3 and R0934F carrying Rf1 and Rf3. The expression profiles of RFL79 and RFL29a—the two candidates for Rf1 and Rf3—are highlighted in blue and red, respectively. TPM: Transcript per million values calculated from RNA-Seq data. Anther stages A, B and C correspond to the three developmental stages of anther development as described in (a–c). e Principal components analysis (PCA) of the read counts for 44 mitochondrial transcripts. The first principal component (pc1, 65% of variance) distinguishes between the three stages in the fertile genotypes and the second principal component (pc2, 14% of variance) distinguishes the fertile and sterile genotypes. f Hierarchical clustering of 44 mitochondrial transcripts based on read counts in fertile lines relative to the sterile line at the equivalent developmental stage calculated from RNA-Seq data. Rf1 = R0932E, Rf3 = R0946E, Rf1Rf3 = R0934F. Early, mid and late anthesis correspond to the three developmental stages of anther development as described in (a–c). This experiment was performed once. Three biological replicates each comprising 15 anthers from 3 to 4 individual spikelets were used for RNA extraction and the expression analysis. Source data underlying Fig. 2a–c are provided as a Source data file. Data and code used to generate the plots in Fig. 2d–f are obtainable from Dryad88.

