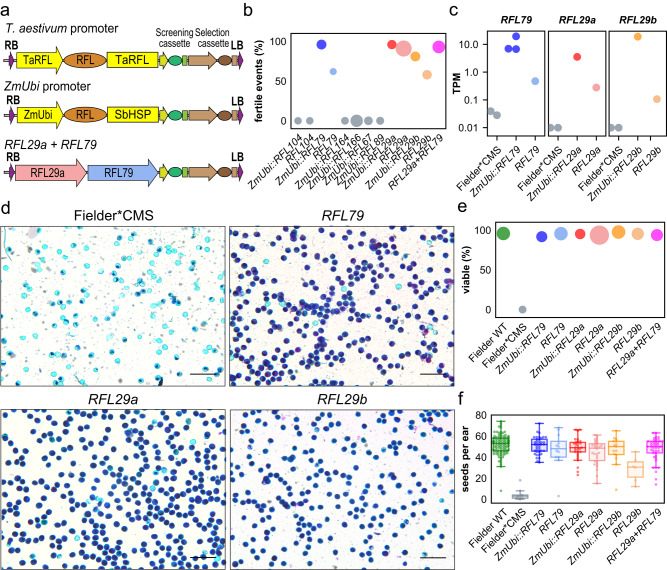
Fig. 3. Transformation of Rf1 and Rf3 candidate genes into the Fielder*CMS line.
a Design of the constructs used in plant transformation experiments. TaRFL, sequence from the wheat Rf candidate gene; ZmUbi, Zea mays ubiquitin promoter; SbHSP, 3′-UTR from Sorghum bicolor heat shock protein gene. The screening cassette consists of the T. aestivum HMWG gene promoter, ZsGreen coding sequence and tNos terminator sequence. The selection cassette consists of a rice actin gene promoter, the bialaphos resistance (Bar) gene and tNos terminator sequence. RB right border, LB left border. b Evaluation of fertility restoration by Rf1 and Rf3 candidates based on the percentage of T0 events giving fertile plants. The area of the plot markers is proportional to the total number of transformation events obtained, ranging from 13 to 69. c Expression level of the restoring transgene in transcript per million (TPM) values calculated from RNA-Seq data. The values shown are TPM + 0.01 to allow the Fielder*CMS results to be plotted on a log scale; all three of these genes are absent from Fielder and undetected in the cases of the RFL29a and RFL29b; a few reads mapped to RFL79 indicating a low level of cross-mapping from related RFL genes. d Alexander’s stain of pollen grains collected from anthers at late anthesis (anther stage C) of Fielder*CMS and restored transformants (T1 generation). This experiment was performed once. The selected micrographs are representatives of 10–15 individual images. Scale bar = 200 μm. e Pollen viability counts from analysis of 10–15 images like those in (d). The area of the plot markers is proportional to the number of pollen grains counted, ranging from 920 to 5215. f Plant fertility based on seed set per ear on T1 plants from five different transgenic events per construct. Number of ears analysed per line: Fielder WT n = 1043, Fielder*CMS n = 125, ZmUbi::RFL79 n = 313, RFL79 n = 92, ZmUbi::RFL29a n = 209, RFL29a n = 197, ZmUbi::RFL29b n = 107, RFL29b n = 43, RFL29a + RFL79 n = 359. Centre line, median; box limits, upper and lower quartiles; whiskers, 1.5× interquartile range. Source data underlying (b) and (d–f) are provided as a Source data file. Data and code used to generate the plots in panel Fig. 3c are obtainable from Dryad88.

