Figure 1.
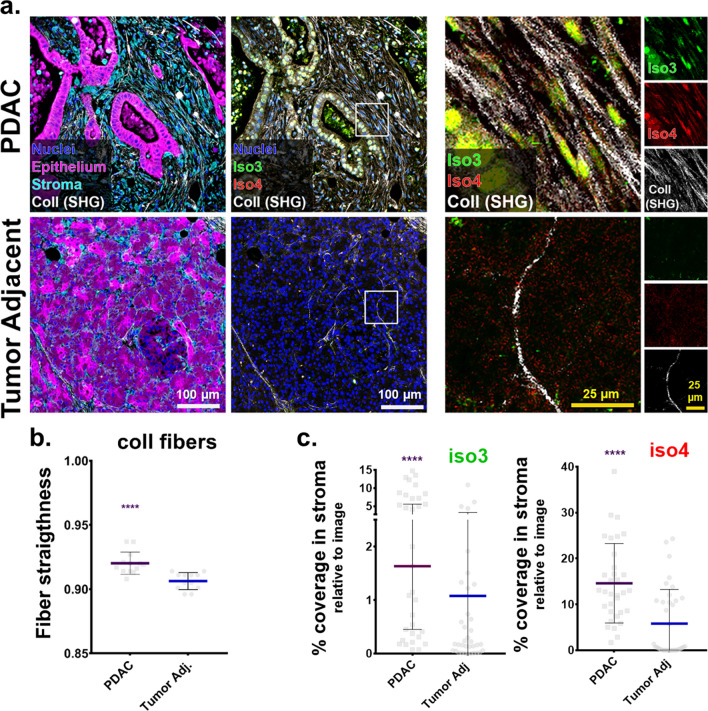
Palladin iso3 & iso4 are upregulated in the fibrillar collagen-rich stroma of human PDAC. (a) Representative images depicting epithelial/tumoral areas (magenta) as well as stroma (cyan) areas in surgical tissue sections, pathologically defined as pancreatic cancer (PDAC) or matched normal/benign pancreas (Tumor Adjacent). The images are representative of 3 patient samples that included SMI as well as SHG assessments, while SMI alone was also conducted in 2 additional surgical sample pairs. Epithelial compartments were labeled with antibodies against pan-cytokeratin, EpCAM, and CD-70 identifying all epithelial cells including cancer cells (magenta). Stromal cell compartments were identified using anti-vimentin antibodies (cyan). Nuclei were stained using DRAQ5 dye (blue). Palladin isoforms were identified using antibodies against iso3 (clone G2; green) and iso4 (clone IE6; red). Fibrillar collagen signatures, detected via SHG, are shown in white. Yellow squares correspond to magnified regions, shown to their right, while far right column shows single colored images corresponding to the same magnified regions. Scale bars are provided for each magnification. (b) Evaluation of SHG generated signatures assessing straightness of collagen fibers. Values were obtained using CT-FIRE software (see “Material and methods”). Each bullet point represents a single image. Three images were acquired from each of the three paired patient samples for a total of nine images from PDAC, and nine from matching for Tumor Adjacent samples. (c) Quantification of the percentage coverage of iso3 or iso4 immunostaining within vimentin positive areas, relative to the total image area. Analysis was carried out using readouts generated by the SMIA-CUKIE 2.1.0 software (see “Materials and methods”). Data presented in (c) correspond to specimens evaluated from all 5 patients, and included a minimum of 5 images per specimen. Graphs show median with 95% CI. Mann Whitney test was used to determine statistical significance: **** p < 0.0001.

