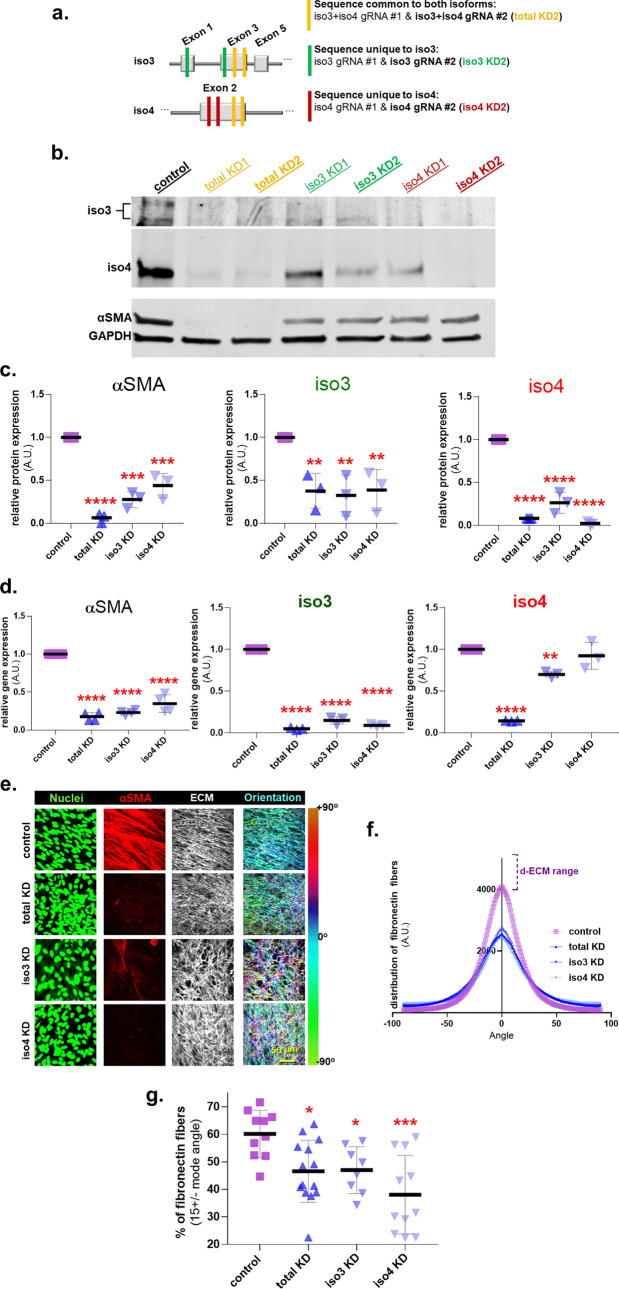
Figure 3.
Palladin isoforms are required for CAFs to sustain a myofibroblastic cell identity. (a) Schematic illustrating the gRNA strategy (for CRISPR/Cas9) used to generate plasmids that target coding sequence common for both isoforms (total KD: yellow lines) or either palladin isoform (iso3 KD: green line, iso4 KD: red line). (b) Representative images of western blot analysis of palladin isoforms and αSMA, using GAPDH as loading controls, in CAFs at the end of ECM production. The upper panel corresponds to the upper portion of the middle panel shown at a higher exposure to highlight iso3 bands, while the middle panel clearly shows iso4. The bottom panel corresponds to αSMA and GAPDH (note that these images were cropped from images generated using the LICOR system). (c) Graphs corresponding to measured protein expression levels of samples as in (b) normalized to 1 arbitrary unit assigned for expression of the assorted protein/GAPDH in control CAF cultures. (d) Graphs depicting relative RT-qPCR quantification of transcripts corresponding to αSMA, iso3, and iso4 normalized to control CAFs, which were set to one arbitrary unit in each experiment. (e) Representative images of control vs palladin KD CAFs at the end of ECM production (selecting for substantial ECM produsing samples). Unextracted 3D cultures were subjected to indirect immunofluorescence. Images show in green, nuclei; in red, αSMA and in white, fibronectin (ECM). Pseudo-colored images depict fibronectin fiber angle distributions corresponding to tone bar on the right, showing cyan fibers as mode angle. ECM fibers of control CAFs present greater levels of cyan pseudo-colored fibers compared to palladin KD CAFs. Scale bar: 50 microns. Analyses of images acquired as in (e) were conducted measuring: fibronectin ECM fiber angle distributions (f) and percentage of ECM fibers out of total fibers at 15° from the mode angle (g). Data presented is derived from experimental duplicates of biological triplicates which rendered enough ECM to conduct the meassurements (n = 6). Each sample was represented by a minimum of 5 images. One Way ANOVA, Dunnett’s multiple comparison test was performed to determine statistical significance compared to control CAFs or alignment threshold * p < 0.05, ** p < 0.01, *** p < 0.001, **** p < 0.0001.

