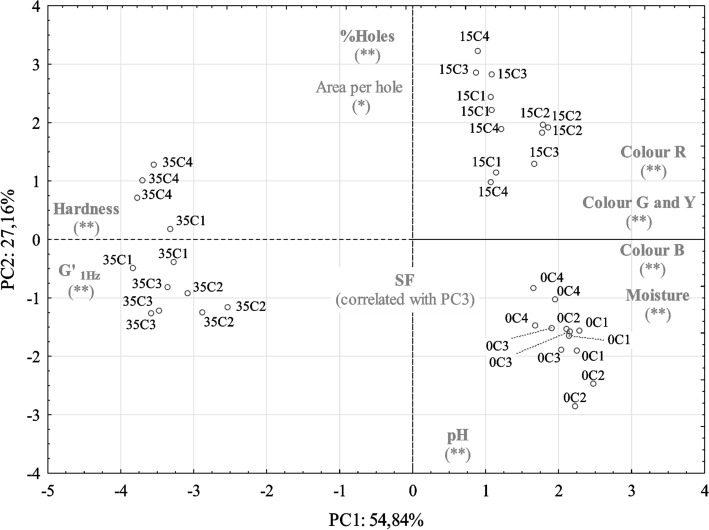
Fig. 4.
Principal component analysis: PC1 vs. PC2 projection of samples (n = 3). The most important variables for the definition of the two components are shown on the edge of each axis, indicating the direction in which the value of the parameter increases. In the plot are represented samples produced with different coagulants (C1 to C4) with different ripening dates (0, 15 or 35 days). *Marked values were considered moderately correlated with the PC; **marked values were considered strongly correlated with the PC, following the classification used previously (Palma et al. 2009; Alvarenga et al. 2018)

