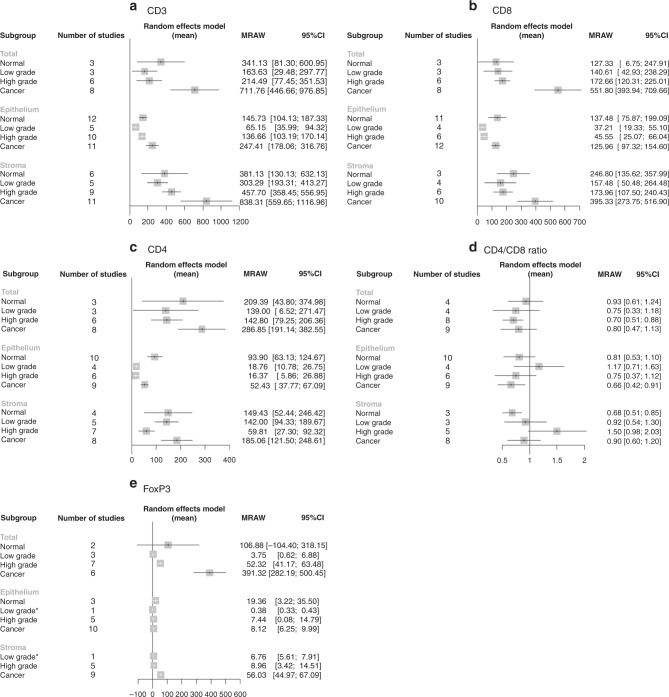
Fig. 2. Forest plots of T-cell infiltrate quantitative meta-analyses.
Forest plots of meta-analyses of infiltrating T-cell markers across cervical disease stages in total tissue, epithelium and stroma expressed as mean cells/mm2 with 95% confidence intervals for the following markers: a CD3, b CD8, c CD4, d CD4:CD8 ratio, e FoxP3. There were no stromal normal FoxP3 reports, so this category is absent. CIN cervical intraepithelial neoplasia, LG low grade, HG high grade, MRAW raw (untransformed) mean, CI confidence interval.

