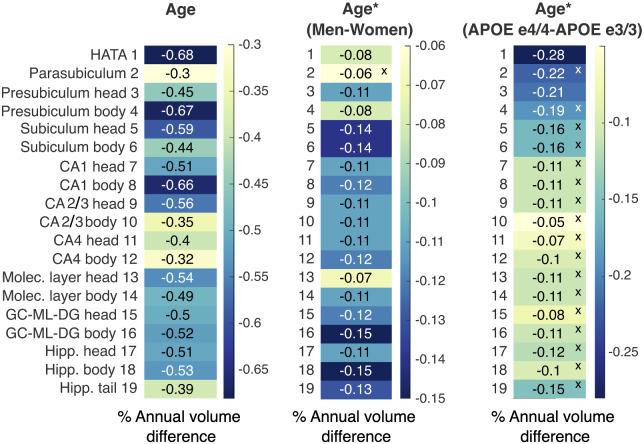
Figure 6.
Percent annual cross-sectional volume difference for each subfield for effects of age, age-by-sex, and age-by-APOE status interactions. Normalized slopes were calculated in three separate linear models that included the effects of interest. Age had the strongest overall effects on annual volume change, followed by male sex. APOE e4/e4 status affected volume reduction beyond the effect of age only in the HATA and the presubiculum head.

